Hands-on sharing data
Note: this half of the workshop we will split the participants based on their previous experience and tools they are using. If you can answer “yes” to the following questions, you are on the correct page:
- I don’t use code (R, Python, Matlab, Julia, etc) to analyse my data
- I would like to use a tidy data format to make my data machine readable
- I would like to use onedrive / google docs / similar software for version controlling my work.
Exercise B1: reflection
5-10 minutes
Go through your e-mail and look for the last time you sent some colleague or colaborator data or if all your data is shared in the cloud: the last time you uploaded new data. Suppose you move to a different university, your mailbox is closed and some stranger needs to use your data for a project. Would they have enough information to do so? What would you do differently next time?
Discuss in pairs of 2.
Introduction
Whether you are working in an experimental, computational or design oriented scientific field, data is often either the final or at least an important product of your scientific research. When working in science, we seldom work in isolation, so sharing data and being able to track mutations and versions of the data and it’s connected metadata should be an import aspect of your work. Because usually we grow into a project without having much education on very practical things such as where to store data, how to handle file structure, how to define versions of the data and how to handle mutations and version change, we decided to focus on these aspects in a very practical manner.
In this part of the workshop, we will provide you with hands-on practical handles on how to collaborate on data. We will provide you with ways how to communicate on your data workflow and you will learn how to administer and track changes to your data. We will share some good practices on how to deal with sharing of data with others as well.
The contents of this part of the workshop:
- sharing and working with data in Excel
- Version control on data and text.
Data flows in ONTOX
ONTOX is a data intensive project. Meaning, there is a lot of data collection going on in the project. While there are several ongoing developments to automate and standardize the data formats in ONTOX, many of us use a spreadsheet program such as MS Excel to gather and document data. In a large AI based project such as ONTOX, we need to keep in mind that the data does not only need to be understandable for us. It also needs to be machine readable (or at the very least: really easy to convert to machine readable data). Therefore, we will discuss how to best store data in tabular (in this case spreadsheet) formats.
Exercise B2: What can go wrong with data in Excel
Exercise by FAIR in (biological) practice course on carpentries-incubator. (see below for full reference)
15 minutes
Tables are one of the best forms of storing and representing information. That is why we find them almost everywhere, from a menu in a restaurant, a bank statement, to professional databases. No surprise then that we biologists love tables and we tend to predominantly use Excel.
Excel is easy to use, flexible and powerful, however, it often gives us too much freedom which leads to bad practices and difficult to re-use data and metadata.
Have a look at the following example data-file in Excel (you can download it here):
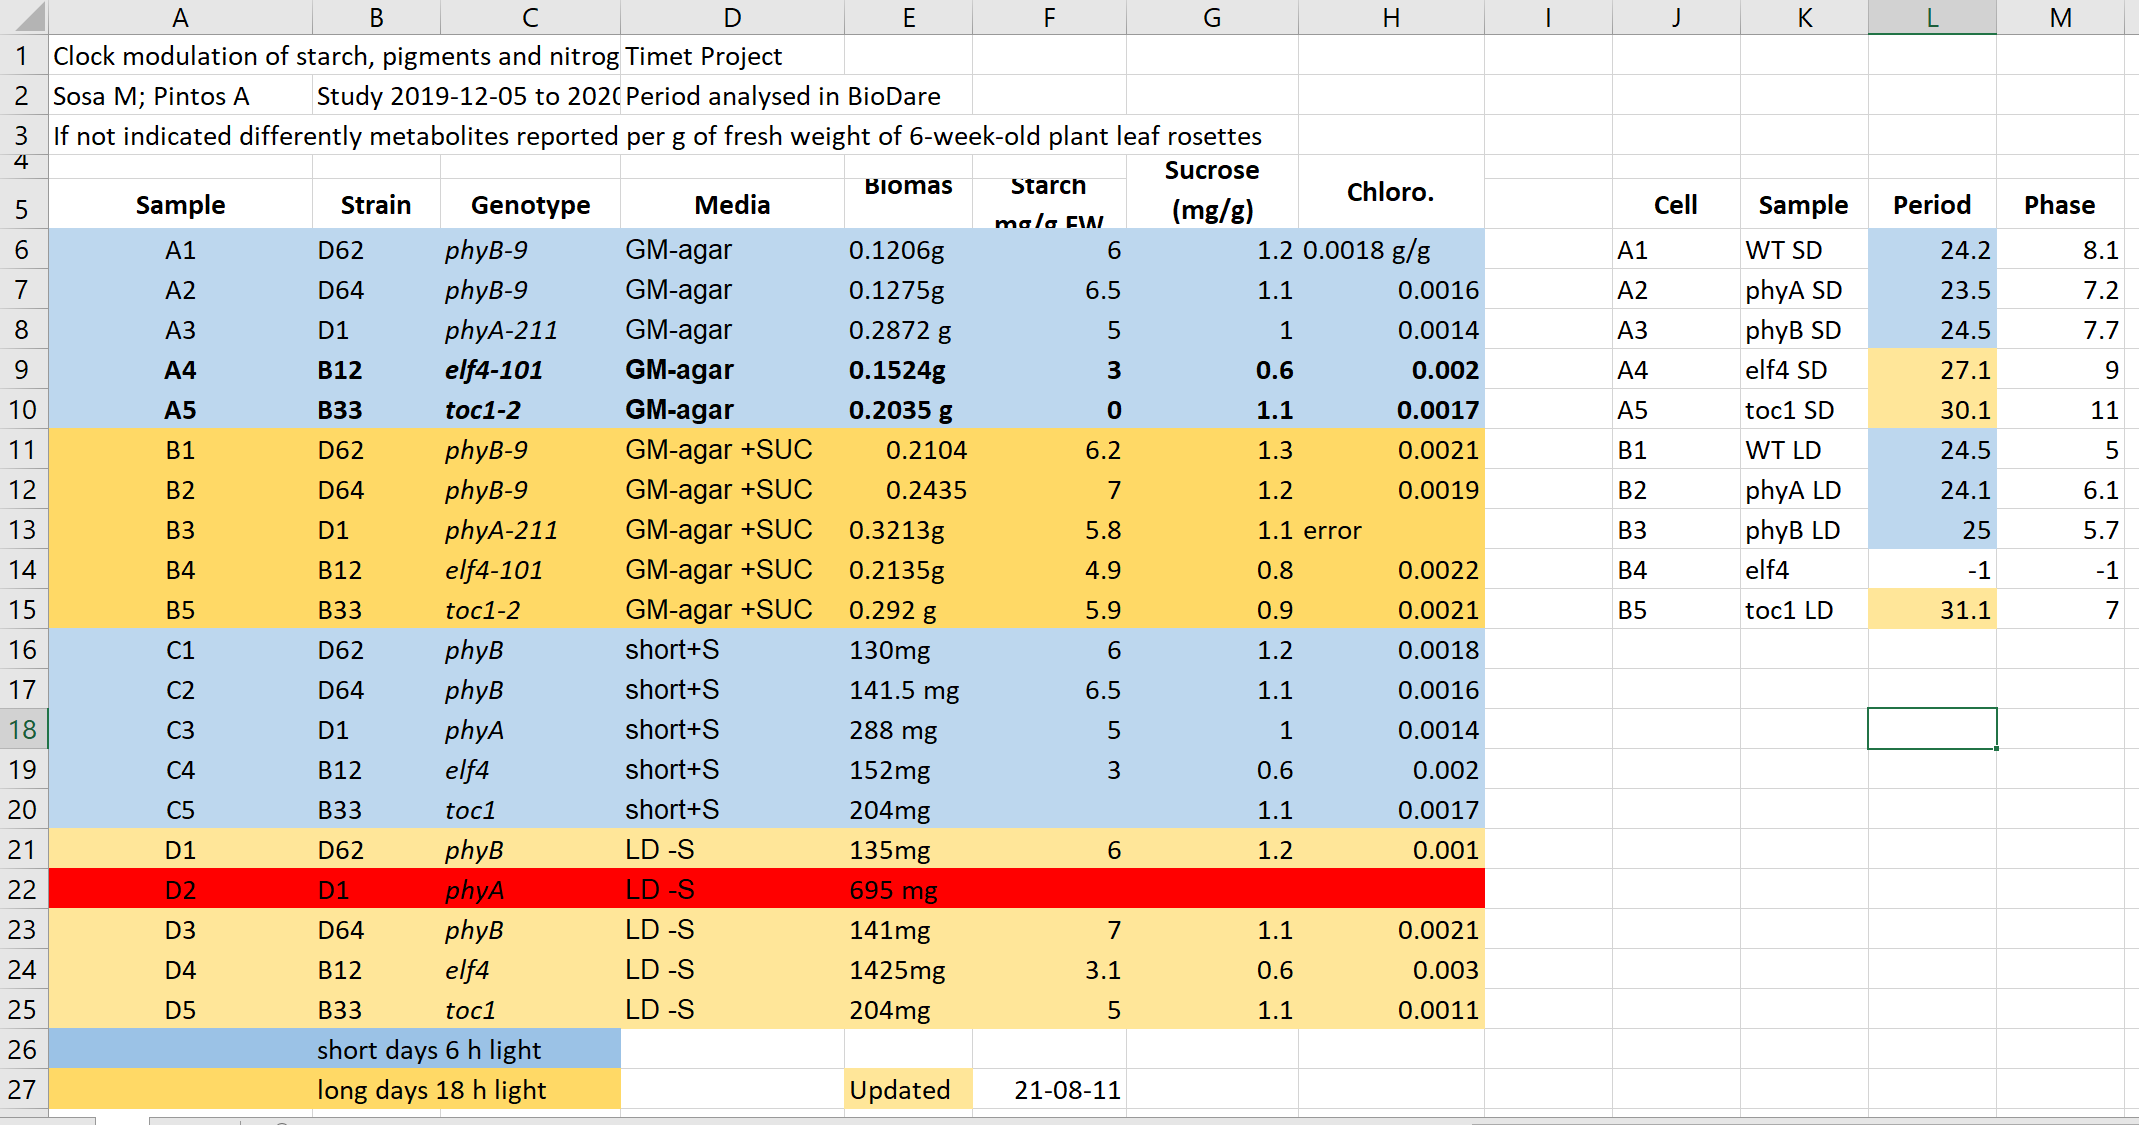
It contains data similar to the presented data before from experiments on plants in different light conditions. Imagine you need to work with this file, and you got it emailed from a collaborator.
- What do you find confusing? What would you try to clarify with the author before doing anything with the file?
- What will be the issues with calculation of: average biomas, biomas per genotype?
- Typically, more advanced data analysis is done programmatically, which requires either conversion to text format as csv, tsv format or using a library that reads Excel files and “kind of makes this conversion on the fly”. Save this file in a text format, close Excel and reopen the saved files. What has changed?
- Have you seen similar tables? Do you believe this example is realistic and replicates real-life issues?
Click here for a solution
- This file hopefully unrealistically exacerbates typical bad practices in Excel.Some things that may be confusing:
- Why are there two tables, are the period measurement related to the metabolics i.e. same samples?
- Do colors in the period table have the same meaning? Seems no.
- Why can row 22 be read, whilst row 13 says error?
- What is the meaning of values in the media column?
- Are the genotypes the same in different blocks or not?
- What is the meaning behind bold text in the table?
- What is the definition of the terms/why are units missing/inconsistent?
- Before averaging the biomas weight, they need to get converted the same unit and the text needs to get replaced by the unit. - Averaging per genotype needs manual selection of suitable entries
- Information about light conditions is completely lost. - Header columns are scrambled. - The update date may change its meaning depending on the location (switch year with day).
Some common spreadsheat errors (that have been spotted in ONTOX):
(shortened and reworded accordingly slightly from source at carpentries-incubator.github.io)
- Not filling in zeros It might be that when you’re measuring something, it’s usually a zero, say the number of times an adverse effect is observed in the survey. Why bother writing in the number zero in that column, when it’s mostly zeros? However, “I counted zero adverse effects” is diffent from “I did not measure this, this data is missing”. Make sure to record zeros as zeros and truly missing data as empty / missing (so not -999, 999 and definately not 0. computers will conclude that there is data).
- Using formatting to convey information organizing data Never highlight cells, rows or columns that should be excluded from an analysis, or to mark particular properties/conditions. Also never merge cells. Formatting information is not available to analysis software and almost certainly will be lost during processing.
- Placing comments or units or more than one variable in a cell Cells in a spreadsheet should contain one piece of information per cell.
Source: FAIR in (biological) practice. Licensed under CC-BY 4.0 2022. We took Exercise 1: What can go wrong with data in Excel out of context.
Tidy machine readable data
As discussed, tidy data is a way of organising your data in a neat and structured way. If you make your data tidy, it is ensured that it is machine readable (thus can be “shared with AI’s”). This is important in ONTOX, as we want to use the data to build an AI platform.
So for future reference, what is tidy data again:
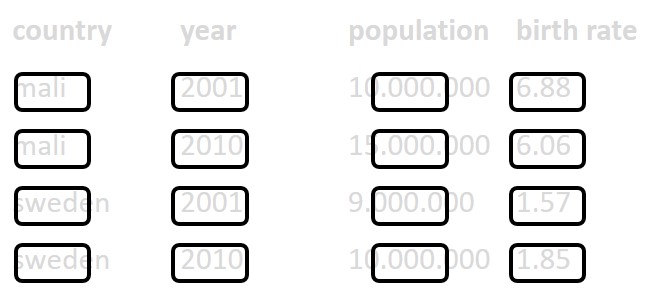
- Each variable must have its own column.
- Each observation must have its own row.
- Each value must have its own cell.
Table1: Example of tidy data
| country | year | population | birth rate |
|---|---|---|---|
| mali | 2001 | 10.000.000 | 6.88 |
| mali | 2010 | 15.000.000 | 6.06 |
| sweden | 2001 | 9.000.000 | 1.57 |
| sweden | 2010 | 10.000.000 | 1.85 |
Each variable must have its own column.
Each observation must have its own row.
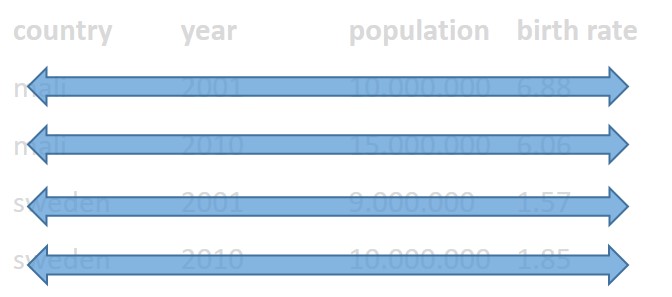
Each value must have its own cell.
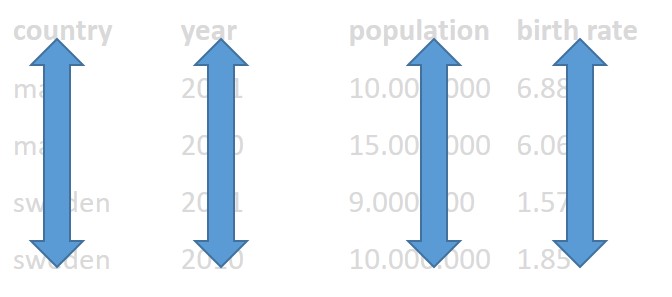
So the following table would by untidy, as there are multiple observations per row:
Table2: Example of untidy data
| participant | sample1 | sample2 | sample3 | sample4 |
|---|---|---|---|---|
| John | 7.5 | 6 | 8.2 | 8 |
| Mary | 8 | 7.9 | 5 | 9 |
This would be the tidy version:
Table3: Example of untidy data made tidy
| student | sample | stairs_walked |
|---|---|---|
| John | 1 | 7.5 |
| John | 2 | 6 |
| John | 3 | 8.2 |
| John | 4 | 8 |
| Mary | 1 | 8 |
| Mary | 2 | 7.9 |
| Mary | 3 | 5 |
| Mary | 4 | 9 |
Exercise B3: tidy data
(15 minutes)
Take a look at an example (fake) dataset on blood levels for several compounds in hepatitis patients, blood donors and suspected hepatitis patients in Utrecht, the Netherlands here. Data was collected between January 2022 and May 2022 by K. the Frog, PhD. It doesn’t look that bad, especially compared to the example from the previous exercise. But it is not machine readable.
Make this dataset machine readable and store it in a reproducible way. Keep the following in mind:
- Tidy data: Each variable its own column. No duplicate columns. Each observation its own row. Each value must have its own cell.
- One datatype per column, be consistent
- notes in a separate column
- don’t use formatting to convey information
- never throw away or change a raw datafile. Raw data = however YOU received the data, be it from a machine, handmade in Excel yourself, or received through email.
- data always needs meta data
Version control on documents and data
You may know from experience how an unnoticed change in a document, the use of the wrong version or the loss of edits can lead to loss of time invested, frustration and above all confusion! This is why keeping a record on all mutations on a document or the data is important. There usually will be quite a lot. Especially, tracking mutations on the data is important for another reason: reproducibility and validity of conclusions (or any other interpretation or cummunication) connected to the data.
Version control is the process of tracking and managing different versions (or drafts) of a file / document / dataset. By doing so, you always know what is the most recent version of a file, when something was changed and what was changed.
Think of it as keeping track of any changes, on top of keeping your file.
So instead of:
file –> file-version_2 –> file_version_final –> file_version_final_2 = file_current
You keep track of:
file + changes_06_06_2022 + changes_07_06_2022 + changes_22_06_2022 = file_current
This has the added advantage of making it easier to merge changes from two separate collaborators. “Added advantage” with respect to reproducibility, but in case of the file being a manuscript written with >2 co-autheurs, we all know this could be a huge help.
If you use code to analyse your data and/or write your manuscripts (e.g. Latex, Rmarkdown), stop here and change to the “advanced” exercises. You should really take the easy route (why not!) and use Github to do the version control for you.
If you use Word and Excel / imageJ / SPSS / etc, keep reading.
Project Version Control: manually
One option that does not make use of storing changes separately is this (proposed) method doing version control manually. It is, however, very easy to implement starting today:
- Whenever you change something significant in your project, just copy the whole folder, and save the old version in a folder with the date of today as the folder name. This may seem wasteful, but remember that storage nowadays is a whole lot cheaper than your time or confusion.
- Document all changes in a changelog.txt file in your main project folder. Write what you changed, who changed it, when and why.
- Save everything on onedrive, or google docs, or somewhere else that keeps backups.
- Keep the /current folder on your laptop if you want to work locally, but remember to backup and sync your project daily with the remote folder.
Your folder structure will look something like this:
laptop/projects
├── project A
│   ├── changelog.txt
│   ├── current
│   │   ├── analyses
│   │   ├── data_raw
│   │   ├── documentation
│   │   ├── manuscript
│   │   ├── methods
│   ├── version_01_02_2022
│   ├── version_14_12_2021
And your changelog may look like this:
├── changelog.txt
01_02_2022
Alyanne: Removed chapter 2 from /manuscript/manuscript.docx and changed statistics to Bayesian (updated folder: /analyses) as per reviewer 1's request.

03_01_2022
optional: keep record of smaller changes as well

14_12_2021
Marc: Added dataset 3 (/data_raw/dataset3_th.csv) from Theme Hospital and wrote script to tidiy data (/analyses/clean_th_data.R).
Marc: Added feedback from Francois (/docs/mail_Francois.docx) to /manuscript/manuscript.docx.
Document Version control using onedrive / google docs
If you are only working on a document, e.g. writing a proposal together with 3 colleagues with no other files involved, you may instead choose to version control the document only. You can do this by using onedrive or google docs to store the document.
Choose one of the 2 links below to read based on whether your organisation uses onedrive or google docs:
Document Version control manually
You could also so this manually, especially if you are not collaborating a lot on this particular file.
Do not fall into the trap of copying your document, then renaming it document_version2.docx, and repeating this step every time. Think the other way around:
- document.docx should always be the current version
- whenever you make bigger changes, keep a copy of the version before those changes with added numbers or dates in the file name as a version controlled log.
Keep a changelog in table format at the beginning of your document or in a file called changelog.txt. e.g.:
| Version | Date | Author | Change |
|---|---|---|---|
| 0.1 | 01-02-2022 | Alyanne | First draft |
| 0.2 | 10-02-2022 | Marc | Added exercise 3.2 |
| 0.3 | 15-02-2022 | Marie | reviewed and corrected French |
| 1.0 | 01-03-2022 | Alyanne | Added chapter 2 |
Exercise B4: version control
(5 minutes)
Take a look at your research project folders.
- Are there multiple versions of the same document? Is it immediately clear which one is the current / used / published one?
- Can you quickly locate the original version?
- Which labeling technique did you use? (e.g. date included in file name, version number included in file name, copying the whole project folder, adding “final” several times.)
- How would you prefer to version control your next project?
- What would you need to start doing so?
Exercise B5: workflow
(15 minutes)
Create a diagram of your research process. Do this however you prefer, with software, with pen and paper, etc. Locate the materials that you are creating, collecting, and editing as part of your research process and answer the following questions:
- Will your research materials be edited or transformed between the time that you collect them and the time you publish them in your thesis or dissertation? If so, is it important to save the intermediate versions? What conventions might you use to track the versions?
- Do you expect to combine multiple files into a single file (e.g., editing multiple clips into a single video)? If so, how do you plan to manage the relationships between the original objects and the combined object (e.g., naming conventions, folder context, readme files, etc.)?
Discuss the issues you see within the breakout room, and plan 1 morning in your agenda in the next month to build a plan to tackle them. Then, stick to the plan!
(Exercise borrowed from the Educopia / Institute of museum and library service, Electronic Theses and Dissertations (ETD)plus Guidance Briefs shared under creative commons license CC-BY )
Key Points
- keep your excel files machine readable and umambiguous
- don’t use formatting to convey information in Excel
- use tidy data if possible
- version control takes some effort, but saves a lot of confusion -thus time- in the long run
- always let name_of_your_document.docx be the current version.