Lesson_03 - Gene networks
Learning objectives
The student is able:
- To obtain and interpret KEGG pathway maps of a biological process
- To define the role of oncogenes and tumor supressor in cellular tranformation
- To analyse data using the data analysis workflow in JASP
Forward and reverse genetics
By using the JASP descriptive statistics module we got a brief (and quick) overview of the human genome. The ensembl database consists of 19.986 annotated protein_coding genes. The holy grail in (molecular) biology is to connect genes to phenotypes. Phenotypes can be at any biological level such as transcription regulation (cellular), tumor formation (tissue) or behavioral phenotypes (organism). Which genes are involved and what is their role in a particular process? There are two approaches to study genes and phenotypes:
The classic way is to start with a phenotype and to investigate which genes are involved. This top-down method is called forward genetics. This method is unbiased, because on forehand you don’t know which genes might play a role in the process. Examples of forward genetics experiments are the pioneering work of Mendel and Thomas Hunt Morgan who studied phenotypes in fruit flies. This approach is very labor intense and interpretation of the results could be complicated if phenotypes are caused by the interaction of multiple genes. The forward genetics approach has been instrumental in discovering novel genes in disease phenotypes, in particular single gene disorders. With the recent progress of DNA sequencing techniques this approach is very powerful.
The other method is reverse genetics. The starting point is a gene of interest and by genetic manipulation the role of this gene in a particular phenotype is being studied (bottom-up method). A common genetic manipulation is to delete a gene from the genome of a model organism. The genetically modified organism is subsequently being studied for phenotypes of interest.
Moleculair pathways
To summarize the role of genes in (disease) phenotypes “molecular pathways maps” are constructed. This summarizes all the results of forward and reverse genetic research methods. These maps can reveal (depending on the phenotype):
- Which genes are involved in a particular phenotype
- What is the relationship between genes in this process
- Type of interaction between gene products (activation / inhibition)
- Location of gene products in the cell (membrane, nucleus, cytosol, organelles)
- Post translation modifications of gene products
- Enzyme reactions
- Complex phenotypes by combining multiple pathways
KEGG
Before we start doing research and formulate research questions we have to gather information about our research subject. An excellent starting point are the above described molecular pathway maps. These can be found in many different databases. Here, we will use the KEGG (Kyoto Encyclopedia of Genes and Genomes) database. KEGG provides interactive pathway maps in which the molecular relationship between genes is visualized within a biological process.
In lesson_01 we have explored the incidence of different types of cancer in the Netherlands. If we want to treat cancer we must know the underlying molecular biology that drive cell transformation, progression and metastasis. Before we start gathering molecular information on different cancer types, let’s first study how a diseased state is conceptualized in the KEGG database.
- Go to the KEGG database (Figure 31)
- Click on KEGG DISEASE
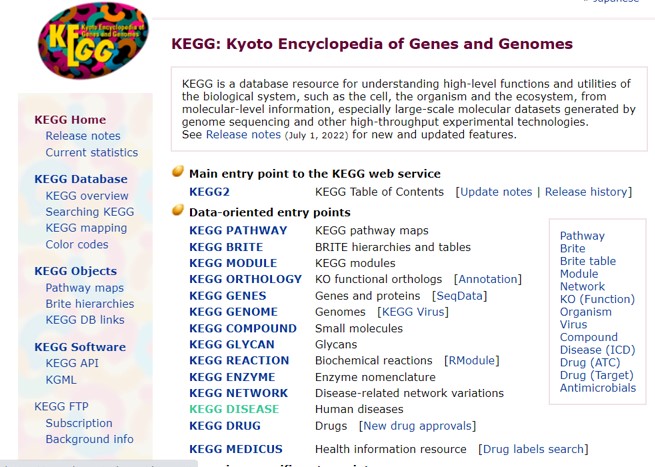
Figure 31: KEGG database
On the KEGG disease page there is a conceptual description of a disease (Figure 32)
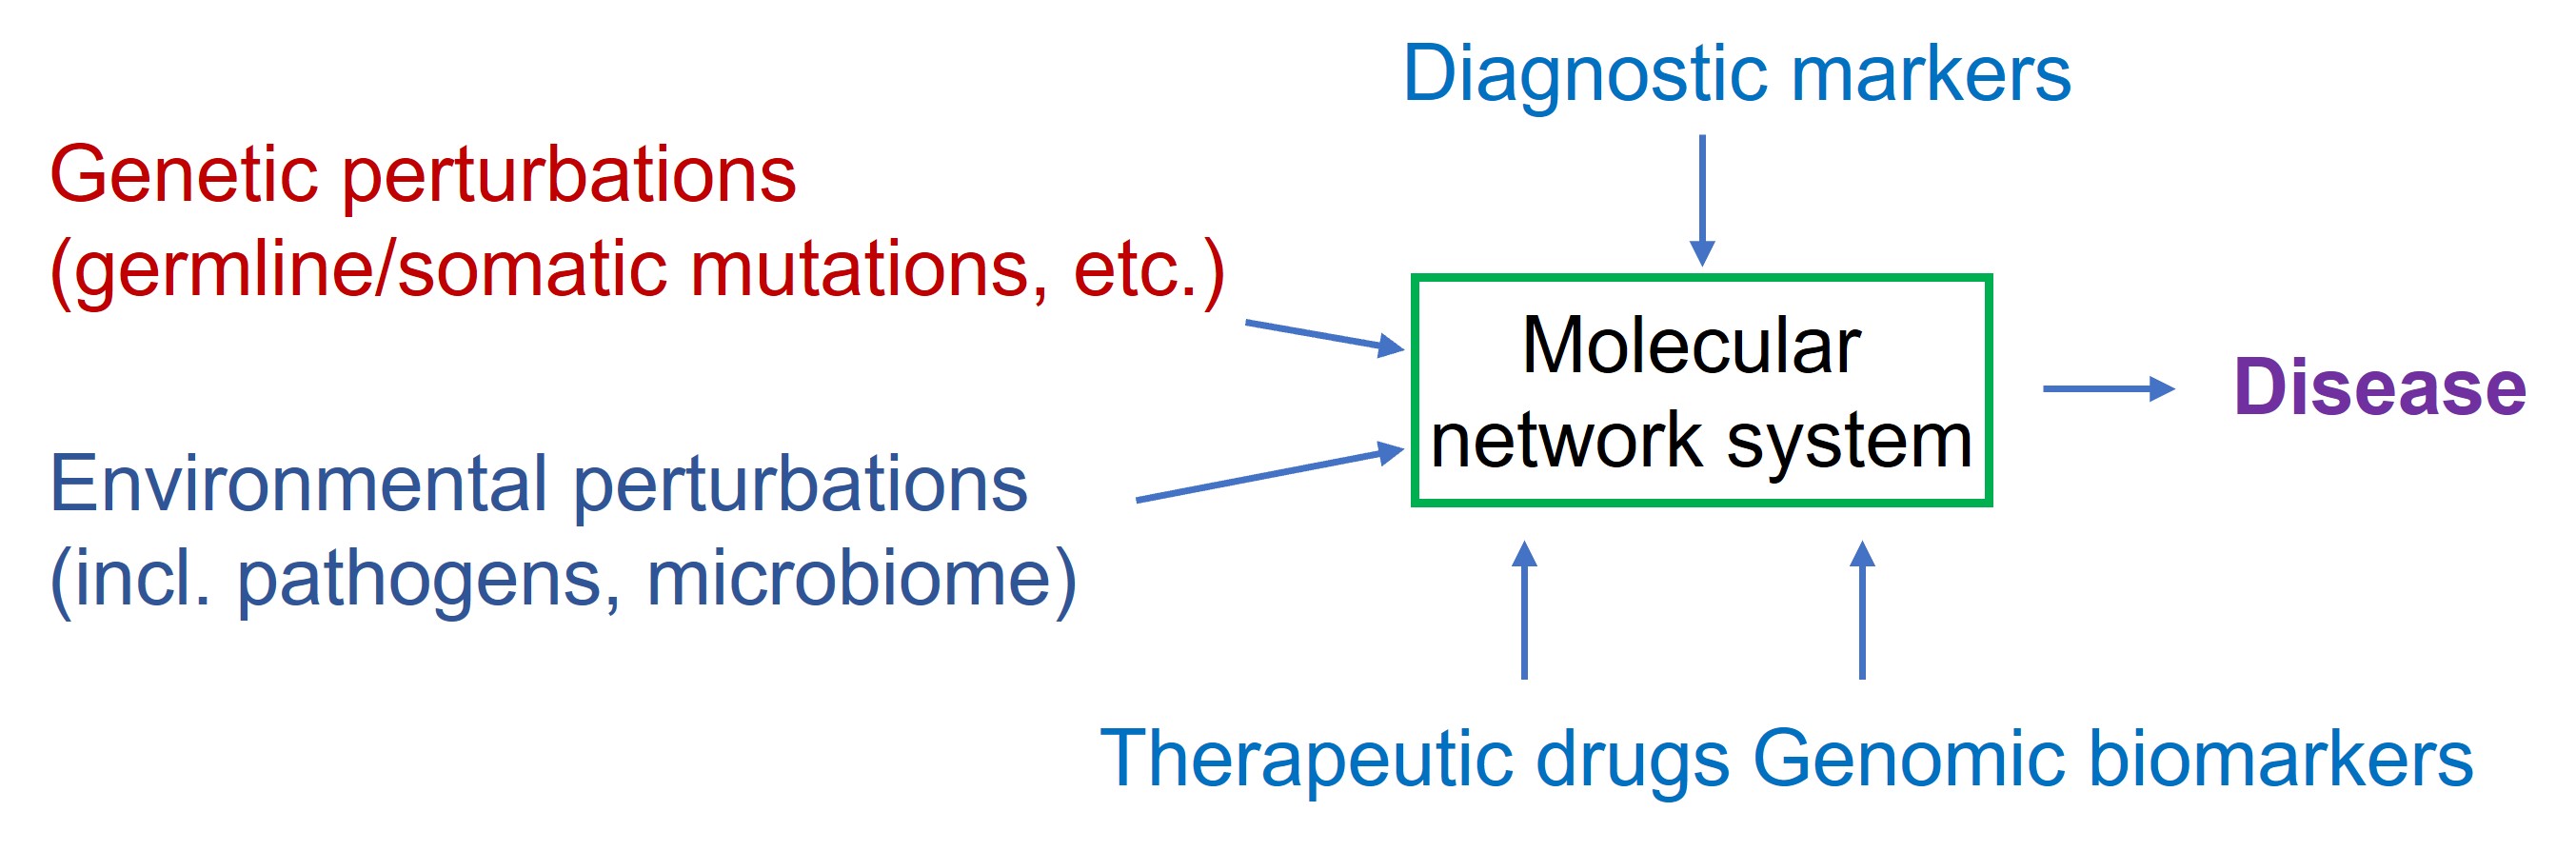
Figure 32: KEGG conceptual framework of a disease
A disease is considered as a perturbation of a molecular network system (which is the interaction of genes involved in a certain process). This perturbation can be of genetic origin (mutations in genes) or environmental perturbations (bacterial / viral infection, diet, trauma, exercises, substance abuse and so on). To interfere with the diseased state therapeutic drugs are used to counteract the perturbed state.
Genetic perturbations in cancer
In the context of cancer, genetic perturbations are mutations that accumulate in the genome and this could possibly lead to cellular transformation and development of cancer (Knudson theory).
- If a gene becomes too active after a mutation and this leads to cellular transformation, the gene is called an oncogene
- If a gene becomes less active or inactive after a mutation and this leads to cellular transformation, the gene is called a tumor suppressor
In lesson_01 we have seen that cancer of the digestive system has the highest incidence rate in the Dutch population. Using KEGG pathways we use the top-down method to gather information about colorectal cancer:
We start with a (disease) phenotype and obtain information about the genetic perturbations:
In the “Search DISEASE” box we can search for many diseases. A complete list of available human diseases in the KEGG database can be found here or here. A list of infectious diseases can be found here
- Type “colorectal cancer” in the search box (Figure 33)
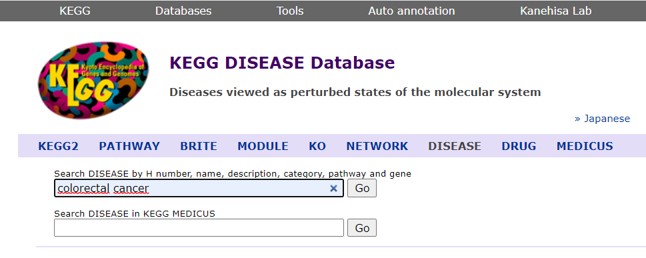
Figure 33: KEGG disease search window
- Click on the first entry in the list (H00020) to view information of colorectal cancer
You will see a summary page with different sections about colorectal cancer such as a list of genes and a list of drugs to treat colorectal cancer. To view the gene signaling map click Pathway: hsa05210
NOTE: A list of all KEGG pathways maps can be found here
At first sight these maps are overwhelming with lots of information. A description of the map can be found under the “Show description” link in the top menu of the interaction map. The legend of the symbols can be found under the “Help” link.
- Click on the Help link and study the legend of the pathways map under “Regular map Notation”
The most important genes in colorectal cancer are summarized in the grey box containing the onco- and tumorsuppressor genes (Figure 34) and a set of DNA repair genes (we will have a closer look at MLH1 in lesson_06). These genes are highlighted in red in the pathway.
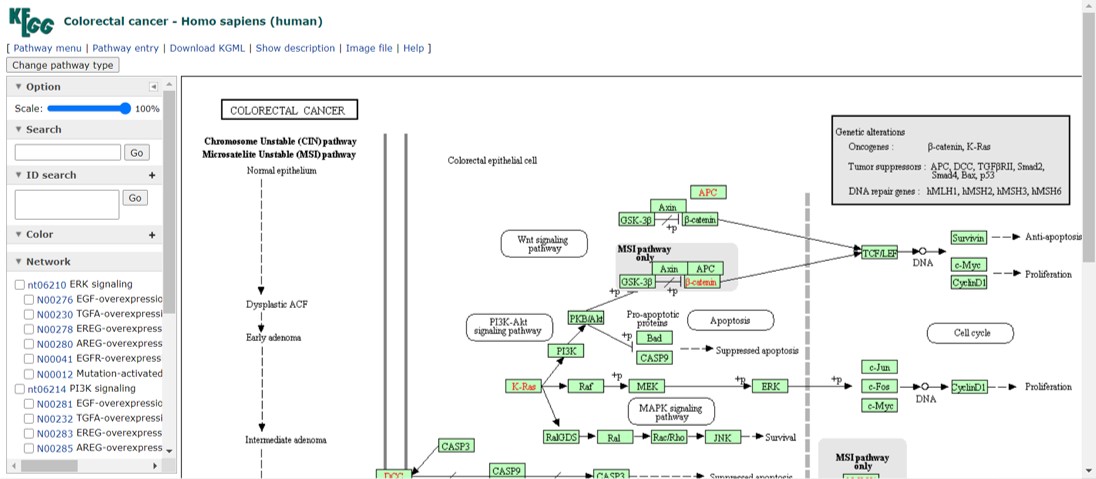
Figure 34: Colorectal cancer pathway map
The colorectal cancer map is composed of several distinct signaling pathways which are listed on the left hand side. If you select a particular signaling pathway, genes will be highlighted in purple.
lesson_03_assignment
Use the colorectal map to answer the following descriptive research questions:
Which genes are in the “EGFR-overexpression to RAS-ERK signaling pathway”?
Within this pathway, what is the relationship between Raf and Mek?
HINT: use the legend under the help link to answer (B)Search for p53 (TP53) in the pathway map. In which cell compartment is P53 active?
Let’s say you want to study TGF\(\beta\) signaling pathway in the context of colorectal cancer.
- Study the TGF\(\beta\) pathway (see Figure 35)
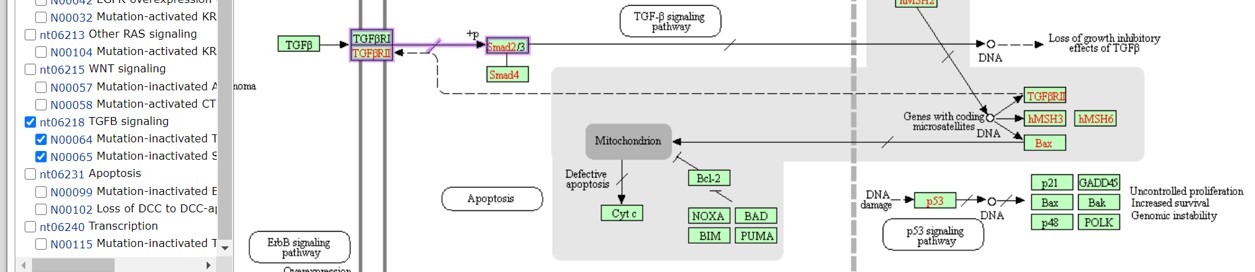
Figure 35: TGFbeta pathway
Normally, activation of the TGF\(\beta\) receptor by TGF\(\beta\) leads to phosphorylation of Smad2/3 proteins. Smad4 is now able to form a complex with the activated Smad2/3 proteins and activates gene transcription leading to an inhibition of cellular growth and therefore inhibition of proliferation. Mutations in the TGF\(\beta\) receptor or the Smad genes leads to inactivation of this pathway. This is depicted in the signaling pathway by a straight line (connecting the genes) which is diagonally crossed by a smaller line. This means that the relation between the two proteins is disturbed.
lesson_03_assignment
What is the cellular location of:
- TGF\(\beta\)
- TGFbR
- Smad2/3
- Smad4
- Smad2/3/4 complex
In the signaling map there are rounded rectangles with the name of a signaling pathway (for example “TGF\(\beta\) signaling pathway”, see Figure 35). The TGF\(\beta\) signaling is a complex pathway and consist of many more genes. Here, in the colorectal signaling map we see a minimal depiction of this pathway in combination with the other signaling pathways to provide an overview. If we want more information on a particular process or signaling pathway, click on the rounded rectangles.
lesson_03_assignment
- What are the target proteins of the Smad2/3 transcription complex?
HINT: Click on the TGF\(\beta\) signaling route to obtain more detailed information
- Which of the target proteins acts as a repressor or as an activator of gene transcription?
- Which protein is also part of the Smad complex?
- Which other Smad proteins are involved in the TGF\(\beta\) signaling route?
We have observed that the TGF\(\beta\) signaling pathway plays a role in colorectal cancer. We have also seen that Smad proteins act as transcription factors regulating gene transcription. We can zoom in and ask how the Smad proteins work at the molecular level. This is the bottom-up approach. We start with a gene and gather as much information in the context of a phenotype, in this case cell transformation. Within the KEGG pathway maps you can click on any gene to gather information about the gene itself.
- Click on the Smad2/3 gene within the colorectal or TGF\(\beta\) map
You will see a summary page of the Smad2 gene with different sections. This page provides a gene’s point of view (bottom-up approach) and list all the network, paths, diseases in which this gene play a role. In addition, there is a section (Other DBs) with links to other databases (NCBI, uniprot and more) containing further information on the Smad2 gene. The NCBI database will be discussed in lesson_04.
lesson_03_assignment
- In which types of cancer does the Smad2/3 complex play a role?
- What is the size of the Smad2 protein?
Environmental perturbations
Environmental perturbations play a role in cancer initiation and progression. Viral carcinogenesis is the process of transformation of normal cells into cancer cells, induced by a virus. For example the Human PapillomaVirus (HPV) is a risk factor in endometrial cancer (uterus). Bacteria are also linked to certain types of cancer. Other environmental risk factors are diet, exposure to environmental pollutants (including cigarette smoke) and an imbalance of the microbiome. The latter is recognized as a risk factor for colorectal cancer.
lesson_03_assignment
Human papillomavirus produces viral oncoproteins which interfere with the molecular signaling routes in infected cells potentially leading to cell transformation
- What are the names of the Human papillomavirus oncogenes?
- What other viruses can cause cellular transformation that leads to cancerous cells?
lesson_03_assignment
Use the KEGG database to answer to following questions:
- Which bacteria is involved in gastric cancer?
- What type of secretion system is used by the bacteria?
- Which proteins are part of this secretion system?
Biologicals
Biologicals are a diverse group of medicines which includes vaccines, growth factors, immune modulators, monoclonal antibodies, as well as products derived from human blood and plasma”.
Monoclonal antibodies bind to other proteins with high specificity. For example if a gene is mutated and produces a protein which is too active, a monoclonal antibodies can be generated and tested for binding and blocking of this overactive protein. The name of monoclonal antibodies (approved for treatment in the clinic) ends on “ab”
lesson_03_assignment
Go to the KEGG disease section and search for gastric cancer:
Which monoclonal antibodies are used for the treatment of gastric cancer?
In 22% of gastric cancer patients Erbb2 (HER-2) is amplified in the genome of the transformed cells meaning that there are extra copies of this gene. The Erbb2 gene encodes a receptor, which after activation activates a signalling pathway involved in cell proliferation (Figure 36). In cells with extra copies of the ERBB2 gene the cell produces extra ERBB2 protein and becomes too sensitive to the activating EGF ligand. This leads to excessive proliferation.
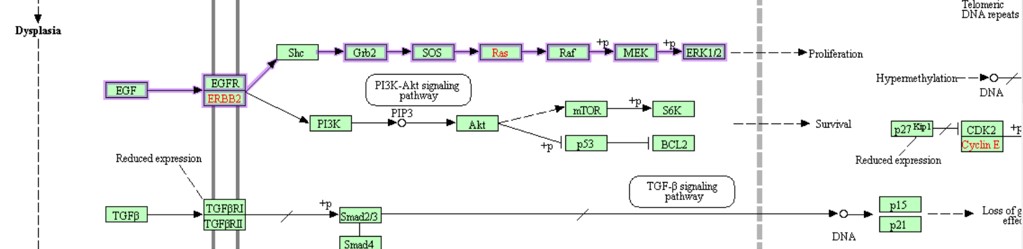
Figure 36: ERB2 pathway in gastric cancer
A monoclonal antibody which can block the activity of Erbb2 is Trastuzumab. A researcher wants to study cell proliferation of gastric cancer cells derived from patients after treatment to Trastuzumab. This way the researcher hopes to predict whether cells of the patients are sensitive to treatment with this therapeutic monoclonal antibody:
Trastuzumab (= experimental variable) -> primary gastric tumor cells (model) -> cell proliferation (= outcome variable)
A method to study cell proliferation is counting the number of cell colonies after treatment with different concentration of the monoclonal antibody. More background information on clonogenic assays can be found here -> study figure 1
Briefly, isolated (gastric cancer) cells are extremely diluted and grown in plastic plates. There are about 10-20 single cells present in the plate. If cells are able to proliferate (cell division) the single cells will grow to a visible colony. Thus, if colonies are formed then there is active cell division. If we treat the cancer cells with the monoclonal antibodies, the cell cycle should become blocked and we should observe less colonies.
The researcher treated the gastric cancer cells from a number of patients with:
- No treatment
- Antibody control (similar antibody which doesn’t bind to Erbb2)
- Trastuzumab
- Mitomycin (inhibit cell proliferation)
Treatment 1 and 2 serve as negative controls -> we don’t expect to see a reduction in the number of colonies
Treatment 3 is the experimental variable -> we don’t know what to expect
Treatment 4 serves as a positive control -> We expect to see a decrease in the number of colonies
(Mitomycin is a drug of which we know that it will inhibit cell proliferation)
After counting the colonies for each condition, the researcher calculated the surviving fraction (SF):
(the number of colonies formed after treatment / number of starting cells in the plate) * 100
The data file lesson_03_opdracht8_trastuzumab.txt is present on the server in folder /home/data/das3v22/lesson_3
- Download data file lesson_03_opdracht8_trastuzumab.txt to your computer
- Open in JASP
- For each of the 4 conditions make a boxplot with a box for each patient (person).
- For each boxplot change the values of the y-axis (see instruction below)
- click on the dropdown menu of the first boxplot and select “Edit Image” (Figure 37)
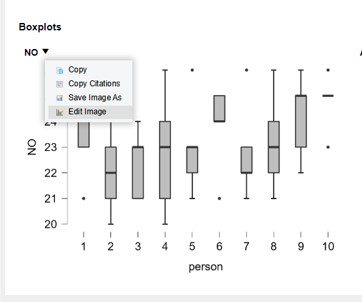
Figure 37: JASP: select Edit Image
- Select y-axis and change the values (from:0, to:30, steps:5) (Figure 38)
- click on “ok” (lower right)
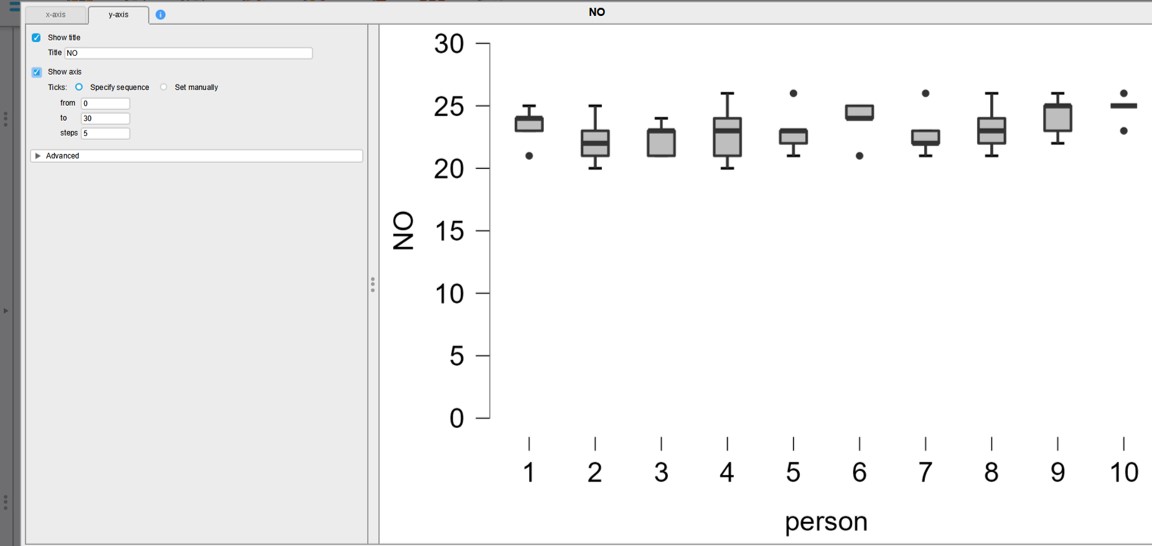
Figure 38: JASP: adjust y-axis values
- Repeat the adjustment of the y-axis for the other boxplot images
- Interpret the boxplots and answer question 8
- Upload the JASP file to the server
lesson_03_assignment
- How do you interpret the negative control?
- Of which patient(s) are the gastric cancer cells potentially sensitive to Trastuzumab?
- Of which patient(s) are the gastric cancer cells insensitive to the Mitomycin?