Lesson_05 - DNA Mutation analysis
Learning objectives
The student is able:
- To explain different types of nucleotide variations in the genome
- To design primers for Sanger sequencing using NCBI primer blast
- To calculate sequencing chromatogram Q-scores
- To interpret a sequencing chromatogram
- To use NCBI blast to compare two DNA sequences
- To read the DNA codon table
DNA variations
The primary sequence of a gene determines the amino acid sequence and thus the structure and function of the protein. We have already learned that a gene can produce different transcripts and thus distinct proteins. In addition, the primary CDS of a gene can also contain DNA variations meaning that different variants (or alleles) can exist in the genome.
DNA variations are caused by single-nucleotide polymorphism (SNP), mutations and genomic structural variation (which will not be discussed in this course). Nucleotide variation has great impact on human health. Mutations in genes cause a variety of health effects such as the onset of cancer and numerous disorders.
Natural genome variation is caused by SNPs. Let’s say that at a specific position in the genome most individuals have a G nucleotide but in a minority of the population this position contains an A. This means that there is a SNP at this site with two nucleotide variations (A/G). On average, SNPs occur almost once in every 1,000 nucleotides, are present in the germline and thus SNPs are inherited. If a SNP is present in a gene then there are variants of this gene (or alleles). A SNP can either result in the same amino acid (silent mutation) or in a different amino acid (missense mutation) which could potentially affect protein function.
Single nucleotide mutations are also variants in the genome at a certain position. They occur sporadic and are present in somatic cells (and thus are not inherited). They are caused by environmental factors (mutagens such as smoke), errors in replication or viral infections. A gene mutation can be silent or missense. In addition somatic gene mutation can also result in a premature stopcodon (nonsense mutation) leading to a shortened or non-functional protein (depending on where the nonsense mutation is present in the gene). There are also splice mutations. They interfere with the ability of the cell to correctly splice the premature mRNA resulting in either the addition of nucleotides from the intron sequence or deletion of nucleotides from the exons in the final CDS leading to a shift in the reading frame leading to a non-functional protein.
Yet,another type of somatic mutations are insertions or deletions (indels). Nucleotides are deleted or inserted in the genome. If this occur in the coding region of a gene this results in a shift of the reading frame. If this occurs at the beginning of the reading frame it leads to a non-functional protein. If it occurs at the end of the reading frame there could still be a shortened functional protein. If an indel is exactly 3 codons (or a multitude of 3) then an extra codon will be deleted or inserted. The effect of this mutation depends on the nature of the amino acid inserted or deleted.
SNPs and mutations can also occur in non-coding DNA. If a nucleotide change or indel is present in a regulatory DNA element such as enhancers and promoters it can possibly affect gene expression.
Cystis fibrosis
Cystis fibrosis (CF) is a recessive inherited disease that is caused by mutations in the CFTR gene. The CFTR gene is expressed in cells such as epithelial cells of the lungs and pancreas that produce mucus, sweat and digestive juices. Mutations in the CFTR gene causes abnormally thick and sticky mucus which obstructs the airways and glands, leading to the characteristic signs and symptoms of cystic fibrosis such as serious lung infections.
Mutations in the CFTR gene are classified according to whether the mutation alters the production, stability or structure of the CFTR protein. The severity and development of the disorder depends on the type of mutation and the position in the gene / regulatory element. This information can also be used as prognostic markers to predict the progression of the disease and also determines the treatment. Therefore it is very important to sequence the DNA of the patient and to characterize mutations.
DNA Sequencing
A method to sequence DNA regions is sanger sequencing. This method can only sequence short pieces of DNA of about 300 to 1000 base pairs. The quality of a Sanger sequence is often not very good in the first 15 to 40 bases because that is where the primer binds. Sequence quality degrades after 700 to 900 bases.
To determine if and what type of mutation is present in the genome of patients we start with a work plan:
- Select a region of the (human) genome that need to be amplified by PCR
- Design primers to amplify the selected DNA region of about 500-1000 bp by regular PCR
- Design primers for DNA sequencing reaction: for each sequencing reaction one primer
- Labwork: Isolate DNA/mRNA from appropriate cells -> amplify region of interest by PCR -> Sanger sequencing
- Interpret the results of the sequencing reaction (chromatogram)
CFTR gene
You work in the genetics department of a hospital. Your task is to map mutations in the CFTR gene of patients with symptoms of CF. The first step is to select a region of the human CFTR gene to amplify by PCR. Here we select exon 11 of the CFTR gene which contains several pathogenic mutations.
lesson_05_assignment
- What is the type of research question if you sequence mutations in a genome?
- What is the model system?
- What is the outcome variable?
lesson_05_assignment
- Why is the sequencing reaction not directly performed on genomic DNA but is the region of interest first amplified?
- Do you isolate DNA or mRNA from the cells of the patients to amplify (a part of) the CDS of the CFTR gene?
- What is the NCBI nucleotide identifier of the human CFTR mRNA?
- What are the transcript coordinates of exon 11 of the human CFTR gene
Answer C and D are required for the instructions to design primers (see further below)
NCBI primer blast
There are several online resources to design primers. Here we will use the NCBI primer blast tool.
Using NCBI primer blast we can specify which part of the transcript should be used to design the forward and the reverse primers using the range (from, to) option. Within the provided range the NCBI primer blast program scans the sequence and start to design an optimal primer based on several parameters:
- Primer length should be in the range of 18 and 24 bases
- The primer should have a GC content of about 45-55%
- The primers should have a GC-lock (or GC “clamp”) on the 3’ end (i.e. the last 1 or 2 nucleotides should be a G or C residue)
- The primer should have a melting temperature (Tm) greater than 50°C but less than 65°C
- The primer should not include stretches of the same nucleotide
- Avoid primers with secondary structures or the potential to self-hybridize
- Avoid designing primer upstream of stretches of the same nucleotide
- Check primer for specificity in annealing to template (= lack of secondary priming site)
Based on these parameters the program design several primer pairs with a high chance of a successful PCR reaction
Here we want to design primers to amplify exon 11 of the human CFTR gene:
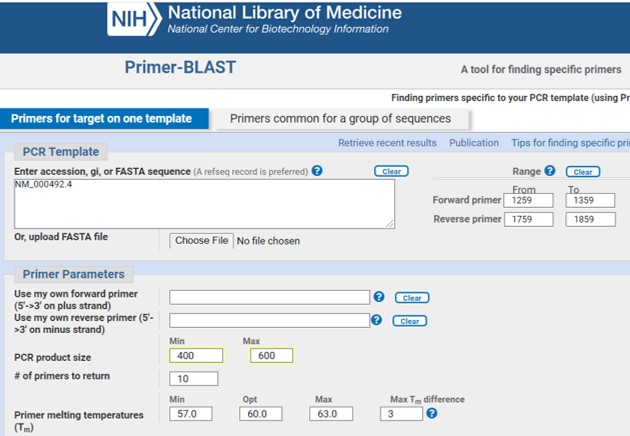
- Provide a NCBI nucleotide identifier of the human CFTR mRNA (see also assignment_2C) (Figure 51)

Figure 51: NCBI primer blast
- Provide a range within this sequence where the forward en revers primers can be designed based on parameters listed above (Figure 51)
The ranges for the forward coordinates are calculated as follows (Figure 52):
- Coordinates of exon11: 1463-1654 (see also assignment_2D)
- Calculate the center of exon 11 (= 1559)
- Extend the center 300 bp downstream and 300 bp upstream to set the region that will be amplified
1559 - 300 = 1259
1559 + 300 = 1859
Here we choose a range of 100 bp. If NCBI primer BLAST can’t design a primer within the set range it is possible to extend the range to 150 or 200. Thus the range of the forward and reverse primers are:
- Range forward primer = 1259 en 1359
- Range reverse primer = 1759 en 1859

Figure 52: NCBI primer blast range calculation
- Select the min and max PCR product size. We have extend the center 300 bp up- and downstream of the center. Thus, the maximum size will be 600. The PCR fragment should not be too small otherwise the sequencing information will be limited. Here we set the minimum PCR fragment to 400
- Use the standard default for the other parameters
- Scroll down the NCBI primer blast page and check the option “Show results in a new window”
- Click on “Get Primers”
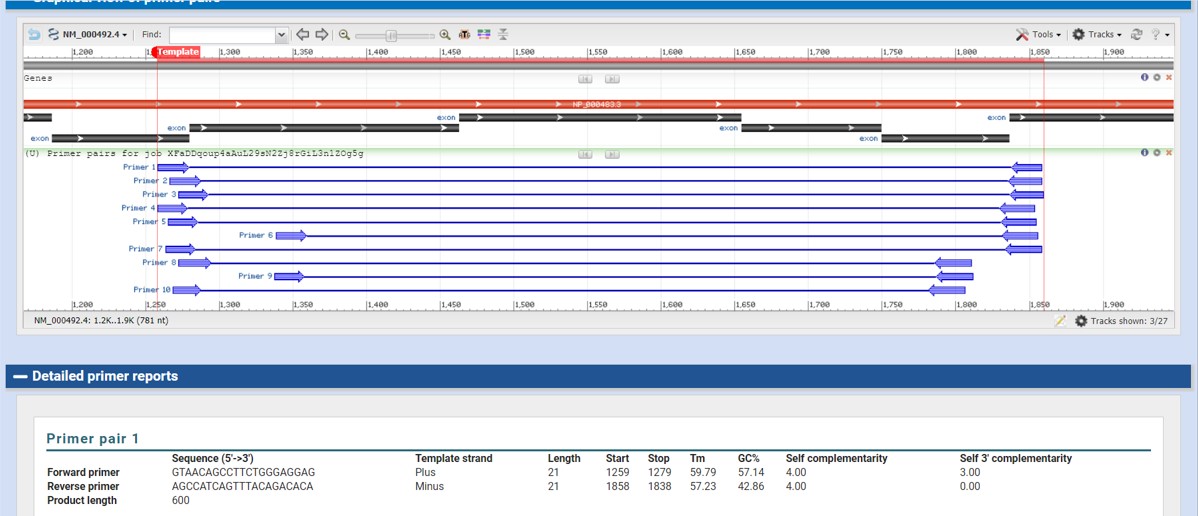
The output should look like Figure 53

Figure 53: NCBI primer blast output
After the program is done you will find a list of primer pairs that can be used for PCR (Figure 53)
The output provide the following information:
- The length of the primers
- Start and stop position within the sequence
- Melt temperature (Tm) which should be quit similar
- Percentage GC (how many C and G are present in the primer sequence)
- Self complementary: the lower the number the better
- Self 3’ complementary: the lower the number the better
We can select set of primers and send those sequences to a company that will synthesize the primers. It is important to note that on beforehand you don’t know whether your primers will produce a specific result. You can only find out when doing PCR and analyze the results on a agarose gel!!
lesson_05_assignment
In the above example we amplified a region around exon 11. But not all mutations are located in exon 11. The mutation R117H (Amino acid arginine is substituted for histidine) is present in exon 4.
Design a forward and a reverse primer to amplify exon 4. Use a similar approach as explained for exon 11
Sequencing primer
After amplification, isolation and cleaning of the DNA fragment (containing the region of interest) we can perform the Sanger sequencing reaction. This is normally done by a company. You provide the DNA fragment and a so called sequencing primer which is required to initiate the sequencing reaction. Because the Sanger sequencing reaction is not optimal for the first 15 to 40 bases the sequencing primer must be at least, to be on the safe side, 100 bp downstream (or upstream) of the mutation (Figure 53, orange dashed lines). To improve the sequencing quality the amplified region is sequenced twice from the 5’end and the 3’end (Figure 54, green arrows).

Figure 54: Designing sequencing primers
Most of the time you can reuse your primers designed to amplify the region of interest. Be aware that in the first step you provide both the forward and the reverse primer to the PCR reaction to amplify your region of interest. In the sequencing reaction you provide the forward primer and the PCR product from the amplifying PCR to start the Sanger sequencing reaction. If you also want to sequence from the 3’end as an extra control you provide the reverse primer and the PCR product from the amplifying PCR to start a second Sanger sequencing reaction
Sequencing Chromatogram
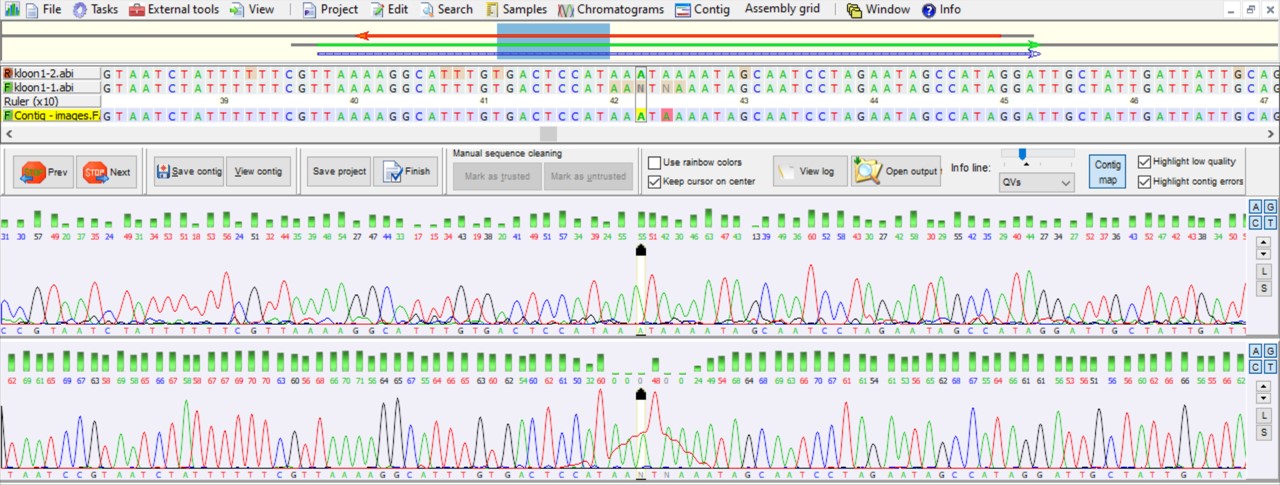
The quality of the sequencing reaction depends on the quality of your input DNA, sequencing primer and the sequencing reaction itself. The DNA sequence reaction is visualized by a DNA chromatogram (Figure 55).

Figure 55: DNA chromatogram
chromatogram Q-score
Figure 55 shows a chromatogram of a forward and a reverse sequencing reaction. In the lower part there are two DNA chromatogram profiles of which the lower profile shows sharp defined peaks compared to the upper profile which contains on average less sharp defined peaks. The sharper the peaks the more reliable the nucleotide sequence! On top of the profiles are the corresponding nucleotide sequences which are merged into a consensus nucleotide sequence (Contig, marked in yellow). The green bars and corresponding numbers represent the quality score of the nucleotides. The formula for the Quality-score is:
Q= -10 x 10log (E)
E is the Error probability, the chance that the nucleotide is not determined properly (this is calculated by the software). For example, the software calculates that for a certain peak there is a 10% chance (or as a fraction 0,1) that the nucleotide is not correct. If we plug this number into the formula we get:
Q-value = -10 x 10log(0,1) = -10 x -1 = 10
Generally, the higher the Q-value the more reliable the peak in the chromatogram and thus the nucleotide calling
lesson_05_assignment
- Calculate the Q-value of a chromatogram peak with a error probability of 0,001
- What is the error probability of a peak with a Q-score of 15
chromatogram interpretation
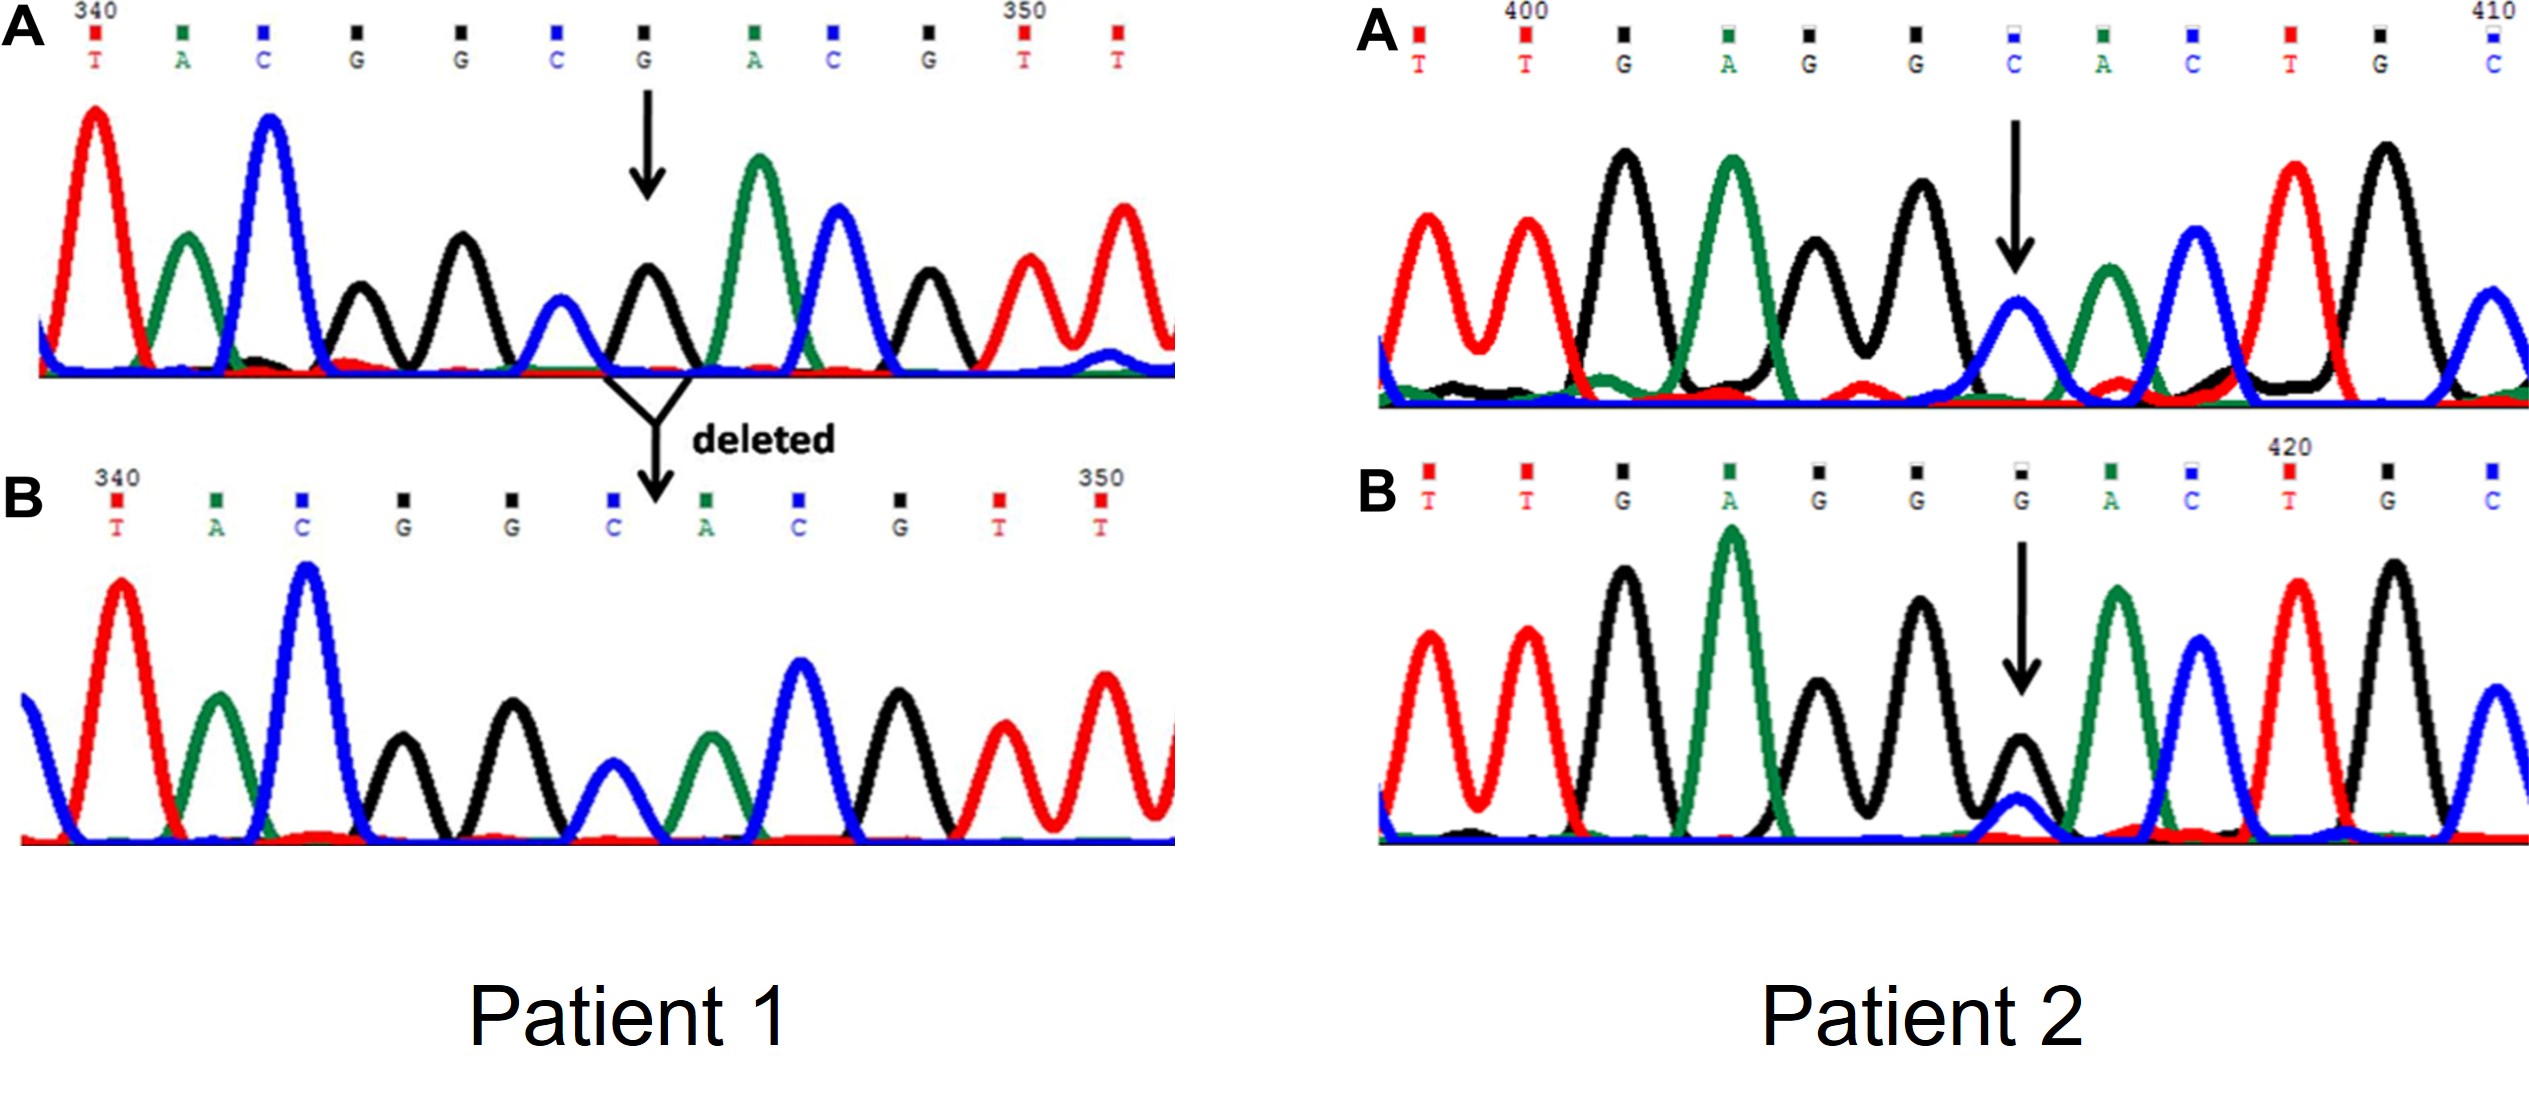
DNA was isolated of a healthy person and two patients with symptoms cystic fibrosis. Part of the CFTR gene was amplified and Sanger sequenced to detect possible mutations (Figure 56).

Figure 56: DNA chromatogram of the CFTR gene
Panel A is the sequence of the healthy persons and panel B is the sequence of the patients.
lesson_05_assignment
- What type of mutation is present in patient1?
- What is the effect of this mutation on the protein sequence?
- What type of mutation is present in patient2?
- What is the effect of this mutation on the protein sequence?
The sequence of patient2 is in frame. Use the dna codon table to identify the change in amino acids - Why are two peaks present at position 405 of the sequence in patient 2?
NCBI Blast
In the previous assignment we eyeballed the sequencing results of 12 nucleotides. But what if we have to spot mutations in large sequences of hundreds or thousands of nucleotides. To compare two sequences of interest we can perform perform a Basic Local Alignment Search TOOL or BLAST analyse. BLAST is a NCBI tool to identify regions of similarity between your sequence of interest (in BLAST called the query sequence) and
- Hundreds of millions of sequences in the NCBI nucleotide database
- A sequence provided by the user
BLAST analysis is used to:
- Identify mutations in biological sequences when compared to a wild-type sequence
- Identify unknown sequences:
- From which species?
- From which region of the genome?
- From which species?
- Identify paralogous sequences (within a species)
- Identify orthologous sequences (between species, showing a evolutionary relationship)
The sequences used for comparison are called the subject sequences in NCBI BLAST. Similarity is based on whether the order of nucleotides of the query sequence equals the order of the nucleotides of the subject sequences. Gaps and mismatches are allowed and the total number of equal nucleotides, number of gaps and mismatches determines the overall sequence similarity:
To practice with the concept of nucleotide alignment, gaps and mismatches answer the next question:
lesson_05_assignment
- How many matches, mismatches and gaps are present in the alignment below

- Make an alignment of the two sequences by hand or use the Global Align tool on the NCBI Blast webpage (scroll down this page to find the Global Align tool)
Query sequence: TTCCAATTGGCGCGTACATAAA
Subject sequence: TTCCTGGCGCGTGCAAAAA
- How many matches, mismatches and gaps are present in your alignment of B?
After many amplifying and sequencing PCR you have finally obtained the sequencing results of the whole CFTR gene.
The sequencing results of the CFTR gene of patient1/2/3 are in files:
human_cftr_NM_000492.4_patient1
human_cftr_NM_000492.4_patient2
human_cftr_NM_000492.4_patient3
These files are in the data directory on the server
Use NCBI blast to compare the sequences of patient1/2/3 to the wild type CDS of the human CFTR
- Go to BLAST (which BLAST version will be used?)
- Check the option “Align two or more sequences”
- Fill out “Enter Query Sequence”: fasta sequence of either patient 1/2/3
- Fill out “Enter Subject Sequence”: fasta sequence of the CDS of the human CFTR gene (retrieve from NCBI nucleotide database)
- Use default settings and click on BLAST
lesson_05_assignment
Describe for each patient the mutation:
- position of mutation
- nucleotide change
- amino acid change
- type of mutation