Lesson_08 - Antimicrobiele resistentie
Learning objectives
The student is able:
- To explain mechanisms of antimicrobial resistance (AMR)
- To explain the concept of prevalence in AMR
- To use the CARD public database to obtain information on AMR
- To make and interpret frequency table, distribution plots and quantile analysis
- To use the NCBI pathogen database to obtain pathogen isolates
Introductie
Infectious diseases are a significant cause of morbidity and mortality worldwide. This is further exacerbated by antimicrobial resistance (AMR). AMR is the ability of microorganisms to withstand antimicrobial treatments. Even though we have a very large number of antimicrobial agents, for each of these reagents it is described that microbes show resistance. Bacteria showing resistance to at least three different classes of antimicrobials, defined as multidrug resistant (MDR), have become common, especially in hospitals. To battle AMR we must learn how bacterial communities can neutralize these agents. The collection of genes in a microbial community that confer resistance to antimicrobiotics is called the resistome. To identify genes that confer resistance to antibiotics, bacterial strains are isolated from infected specimen, in vitro cultivated and tested for AMR for a range of antibiotics and concentrations. Strains that show resistance are subsequently sequenced either for selected genes by qPCR or unbiased with whole genome sequencing to search for gene variants (and thus proteins variants). The complete genomes of thousands of bacterial species and strains are present in the NCBI genome database
CARD database
The list of genes and associated mutations that associate with AMR are categorized in specialized databases. One such database is the The Comprehensive Antibiotic Resistance Database (or CARD) (Figure 72).
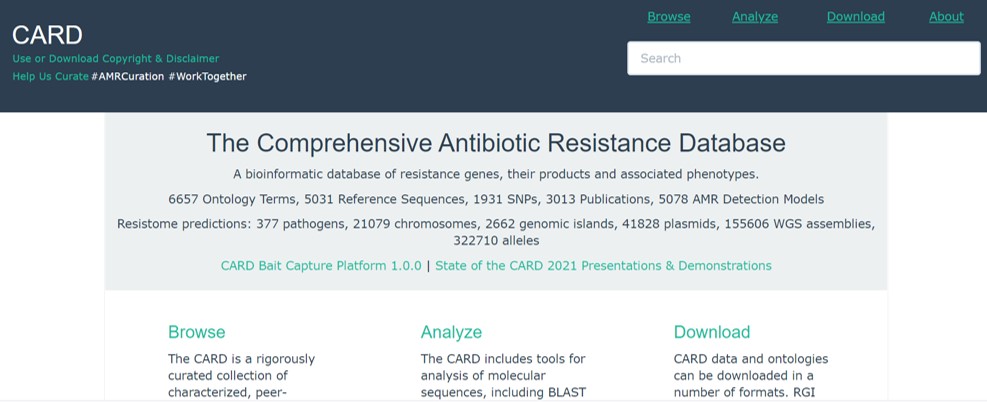
Figure 72: CARD database
This database categorize AMR genes based on mechanisms of resistance against a certain antibiotic. In depth reading about mechanisms of AMR can be found here
- Go to the CARD database
- In the general search window type “mechanism of antibiotic resistance”
lesson_08_assignment
What are the 8 mechanisms of AMR?
To study AMR we want to know:
- To which antibiotics is a specific bacteria resistance
- What are the mechanisms that the bacteria use to become resistant
- Which genes are involved in this mechanism
- Which genome changes (mutations, indels, acquisition of extra genetic material) play a role in AMR
In previous lessons we have learned that a Helicobacter pylori infection is a risk factor for gastric cancer. Helicobacter pylori shows increasing resistance to antibiotics. The Helicobacter pylori pbp1 (=pbpa) protein plays a role in cell wall integrity and maintenance. Antibiotics targeting this protein inhibit cell wall biosynthesis and thus the death of the bacteria. However, mutations in this gene results in a different protein structure and ineffective binding to antibiotics. Mutations in the pbp1 gene (and thus protein) make the bacteria resistance to this antibiotic.
- In the general search window type your own search query to answer the question below
lesson_08_assignment
- Which antibiotic acts on the pbp1 gene?
- What is the mechanism of action of AMR for the pbp1 gene?
- How many unique missense mutations are detected in the pbp1 gene of Helicobacter pylori strains?
CARD: Antibiotic Resistance Ontology (ARO)
To obtain a complete view of the Helicobacter pylori genes that are involved in AMR we can use the ARO tool within the CARD database. The ARO tool is a classification system which shows the relation between AMR genes, associated mechanisms and antibiotics.
- Go to CARD -> Browse -> ARO index
- In the search option of the ARO index type Helicobacter pylori
lesson_08_assignment
- Which Helicobacter pylori genes are involved in AMR?
- To which antibiotics have these genes become resistant?
CARD: Resistomes & Variants
Helicobacter pylori has many different strains (= a genetic variant or subtype of a microorganism). Genome sequences of Helicobacter pylori revealed high levels of genome variation in both gene content and gene order. Therefore, not all strains (=genotype) are equally sensitive to antibiotics (=phenotypes). Helicobacter pylori strains from patients are isolated and sequenced for their whole genome. The next step is to analyze the genome for mutations, indels or acquisition of extra genetic material that are involved in AMR:
- Go to CARD -> Resistomes, Variants, & Prevalence -> Resistomes & Variants
- Loading of the data can take up to 1-2 minutes
The data set contains the genomes of 227 thousand bacteria. Each genome is scanned for the presence of mutations, indels and acquisition of extra genetic material that play a role in AMR
- In the search window type Helicobacter pylori
The database will show all Helicobacter pylori strains with AMR genes variants (Figure 73)
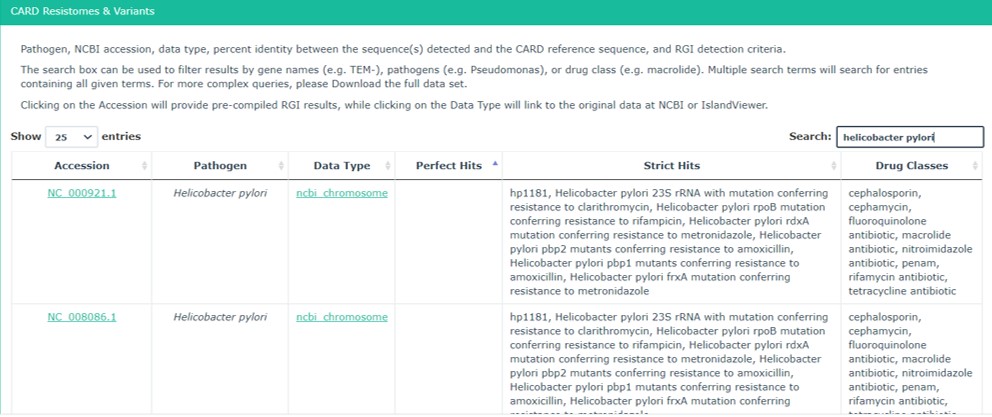
Figure 73: CARD database:Resistomes & Variants
- Click on the first entry in the list (NC_000921.1)
lesson_08_assignment
- Which pbp1 mutation is present in this Helicobacter pylori strain ?
- Which Helicobacter pylori protein in involved in antibiotic efflux ?
CARD: BLAST
In the example above we focused on Helicobacter pylori and searched for genes which play a role in AMR. Another way to study AMR is to focus on a particular AMR gene and ask in which other bacteria strains this gene is present. If similar AMR genes are present this could be a indication that this strain will also become resistant. For example, we can ask the question which bacteria strains contain genes similar to the pbp1 gene?
To address this question we can make use of the BLAST tool which is integrated in the CARD database. The CARD Blast tools compares the query sequence to (gene) sequences that are present in the CARD database and provides additional AMR information of those genes
- Go to CARD -> Analyze -> BLAST
- Obtain the pbp1 (= pbpa) protein sequence of the Helicobacter pylori (strain B38)
(see also lesson_4 for the pbpa nucleotide sequence and lesson_7 on how to obtain protein sequences)
- Use the protein sequence as a query for the CARD BLAST analysis
- Download the BLAST output by clicking on the green rectangle: Download Full Results (Tab Delimited)
- Upload the file to your home directory -> lesson_08
lesson_08_assignment
To answer the questions below we have to process the CARD BLAST output file:
- First inspect the data of the downloaded file:
- What is the delimiter?
- What is the column name?
- how many columns and rows?
- What is the delimiter?
- Think about the software you want to use: bash, excel or JASP (this depends on the questions you want to answer, see below)
- Data organization:
- do we need to split the columns based on the delimiter?
- Do we need to sort the data?
- do we need to split the columns based on the delimiter?
How many different bacterial species are in the list?
(meaning that these strains have a gene that shows similarity to the Helicobacter pylori pbp1 ( = pbpa) gene?Which gene family is mostly represented in the list of similar gene?
What is the type of mechanisms of this gene (of B) for AMR?
HINT: To answer question C use the general search window of the CARD database. Look for a general term and not a specific gene number
CARD: Prevalence
Generally, from a health care perspective we want to know how effective antibiotics are against pathogens. The effectiveness of antibiotics depends on the prevalence of AMR genes in bacterial populations. The prevalence is the proportion of bacterial strains (from the same species) that contain AMR genes. Data scientists from the CARD database scanned the genomes of thousands of strains from 377 bacterial species and counted the proportion of strains in which at least one AMR gene was present. This data is present in the CARD database:
- Go to CARD -> Resistomes, Variants, & Prevalence -> Prevalence
- Scroll down to Phenotype (Figure 74)

Figure 74: CARD database:Prevalence
This data set contains the following information:
Columns: percentage of strains which contain at least one AMR gene that confers resistance to the listed antimicrobial ( = column header)
Rows: bacterial species
In figure 74, we observe that of all Acinetobacter baumannii strains tested, 58.18% contain at least one AMR gene that confers resistance to the antibiotic aminocoumarin.
This data set is present in file lesson_08_opdracht6_CARD_prevalence in the shared folder on the server.
- Copy this file to your home directory -> lesson_08
- Open the file in JASP
lesson_08_assignment
- Calculate for each antimicrobial the mean value in JASP
- Transpose the descriptive table
To which antimicrobial have the bacteria become most resistant?
- Save the file in JASP as lesson_08_opdracht_6_CARD_prevalence.JASP
- Upload the file to your home directory -> lesson_08
Although we get a first impression by comparing the mean value, this is not the complete story. We can have the same mean but the data could be completely different. The mean can be interpreted in two ways (Figure 75):
- Do all the species have a prevalence for AMR genes (Figure 75, column B, average = 12)
- Are there a few species that have a relative high prevalence for AMR genes (Figure 75, column C, average = 12)
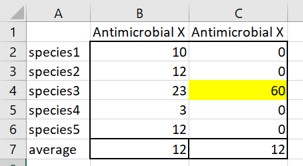
Figure 75: Interpretation of the mean
Generally the mean is affected by extreme values (outliers) or by the presence of zero values in the data set. Here we have a lot of zero values meaning that there is not a single strain of that species that has any AMR genes in their genome against the listed antimicrobial. For example, look at the descriptive values of the polyamine antibiotic: the mean prevalence value is 0,366 (Figure 76).
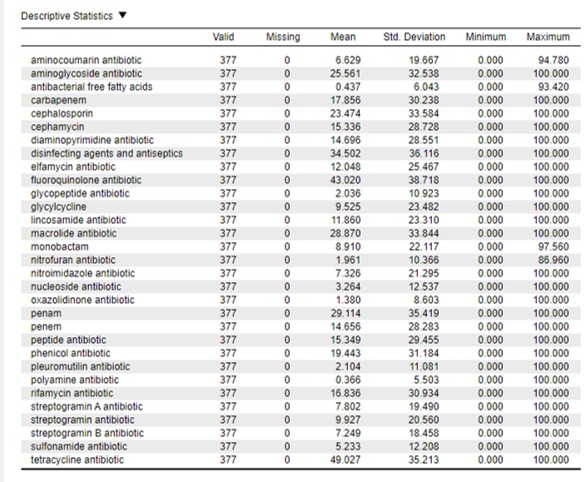
Figure 76: JASP output
If we closely look at the raw data we observed that all species except two do not have any AMR genes against polyamine antibiotic (prevalence = 0).
lesson_08_assignment
Which two bacterial species have a prevalence for AMR genes against the polyamine antibiotic? HINT: Filter column “polyamine antibiotic” and in the descriptive analysis only select column “polyamine antibiotic”
- Save the file in JASP as lesson_08_opdracht_7_CARD_prevalence.JASP
- Upload the file to your home directory -> lesson_08
It is more informative to count for each antimicrobial how many species have zero or low amount prevalence of AMR genes. For example, we consider the mean for these two antimicrobials:
- lincosamide antibiotic (mean = 11,86 %)
- peptide antibiotic (mean = 15,349 %)
We might conclude that bacteria have a slightly higher prevalence of AMR genes against “peptide antibiotic”. Let’s have a closer look at the data:
lesson_08_assignment
For “lincosamide antibiotic” and “peptide antibiotic”:
- Make a frequency table
- Use the frequency table to calculate (by hand, calculator, excel whatever you want) for each of the antimicrobials the percentage of bacterial species (out of the 377 species tested) that have a prevalence of > 0
- Filter “lincosamide antibiotic” and “peptide antibiotic” for values > 0
- Make distribution plots
- Compare the distribution of the two antimicrobials. What is your interpretation?
To better quantify the patterns in the distribution plot we can perform an quantile distribution. The most important quantiles are quartiles, deciles and centiles which split your data in respectively 4, 10 and 100 groups
- Go to statistics -> Quantiles -> “Cut points for x equal groups”
- For x Fill out 10 equal groups
- What is the values of the 50th percentile for Lincosamide antibiotic?
- What is the percentage of values that are below the value of answer A for the peptide antibiotic?
- What percentage of the values are above a prevalence of around 60 or more
- How do you interpret those values and are they consistent with the distribution plots
- Save the file in JASP as lesson_08_opdracht_8_CARD_prevalence.JASP
- Upload the file to your home directory -> lesson_08
`
CARD: Resistance Gene Identifier (RGI)
Another useful tool in the CARD database is the “Resistance Gene Identifier” (Figure 77).
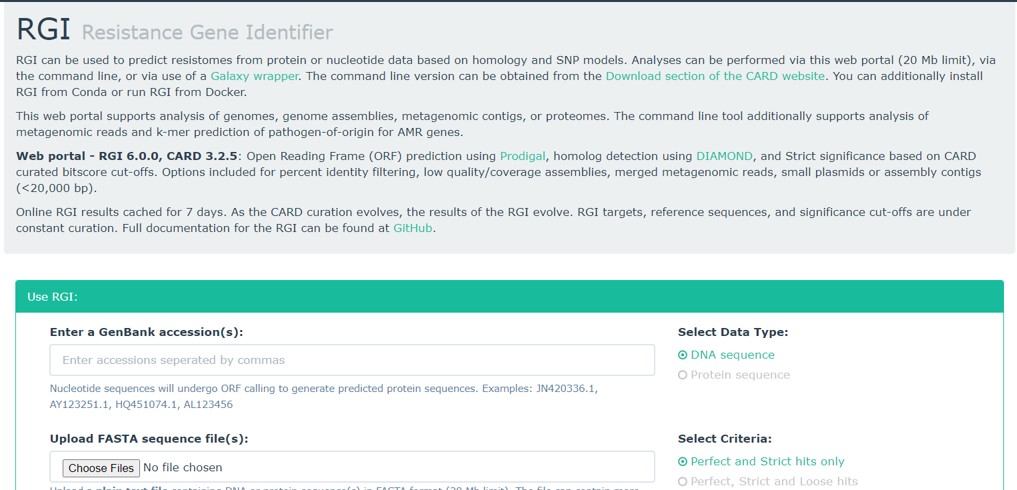
Figure 77: CARD: RGI tool
This tool accepts fasta sequences or NCBI nucleotide accession numbers of bacterial genomes (or part of the genome) and will search for AMR genes. Thus, any bacterial sequence can be tested for AMR genes.
In this lesson we have generally studied the genome of Helicobacter pylori for AMR genes. Here, we ask the question whether different AMR genes are present between different strains
- Go to the RGI tool: CARD -> Analyze -> RGI
- Go to NCBI nucleotide database
- Type “Helicobacter pylori AND complete genome”
- Copy the accession number of strain B128_1
- Paste this number in the “Enter a GenBank accession(s):” in the CARD RGI tool
- Scroll down and press Submit
- Repeat the RGI analysis for strain B38
lesson_08_assignment
Which different mutations in AMR genes are present between strain B128_1 and B38?
NCBI pathogen
The NCBI pathogen database collects all sequences from bacteria and adds additional information such as sample location, isolation source and much more (Figure 78).
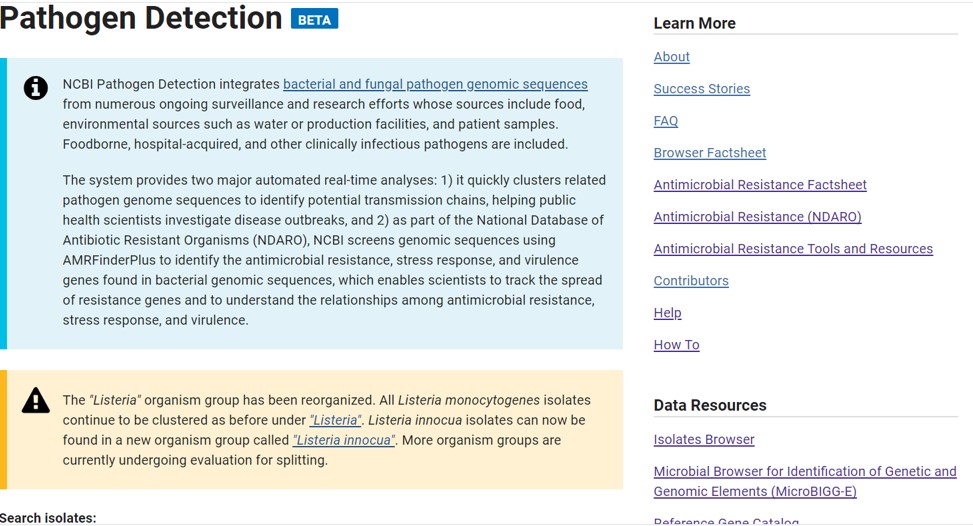
Figure 78: NCBI pathogen database
This database has many different tools to analyse the presence of AMR genes in bacterial genomes similar as the CARD database. Here, we will use the “Isolates Browser” (Figure 78, right menu -> Data Resources -> Isolates Browser)
- Go to the Isolates Browser
- Click on Filters (Figure 79, red rectangle)
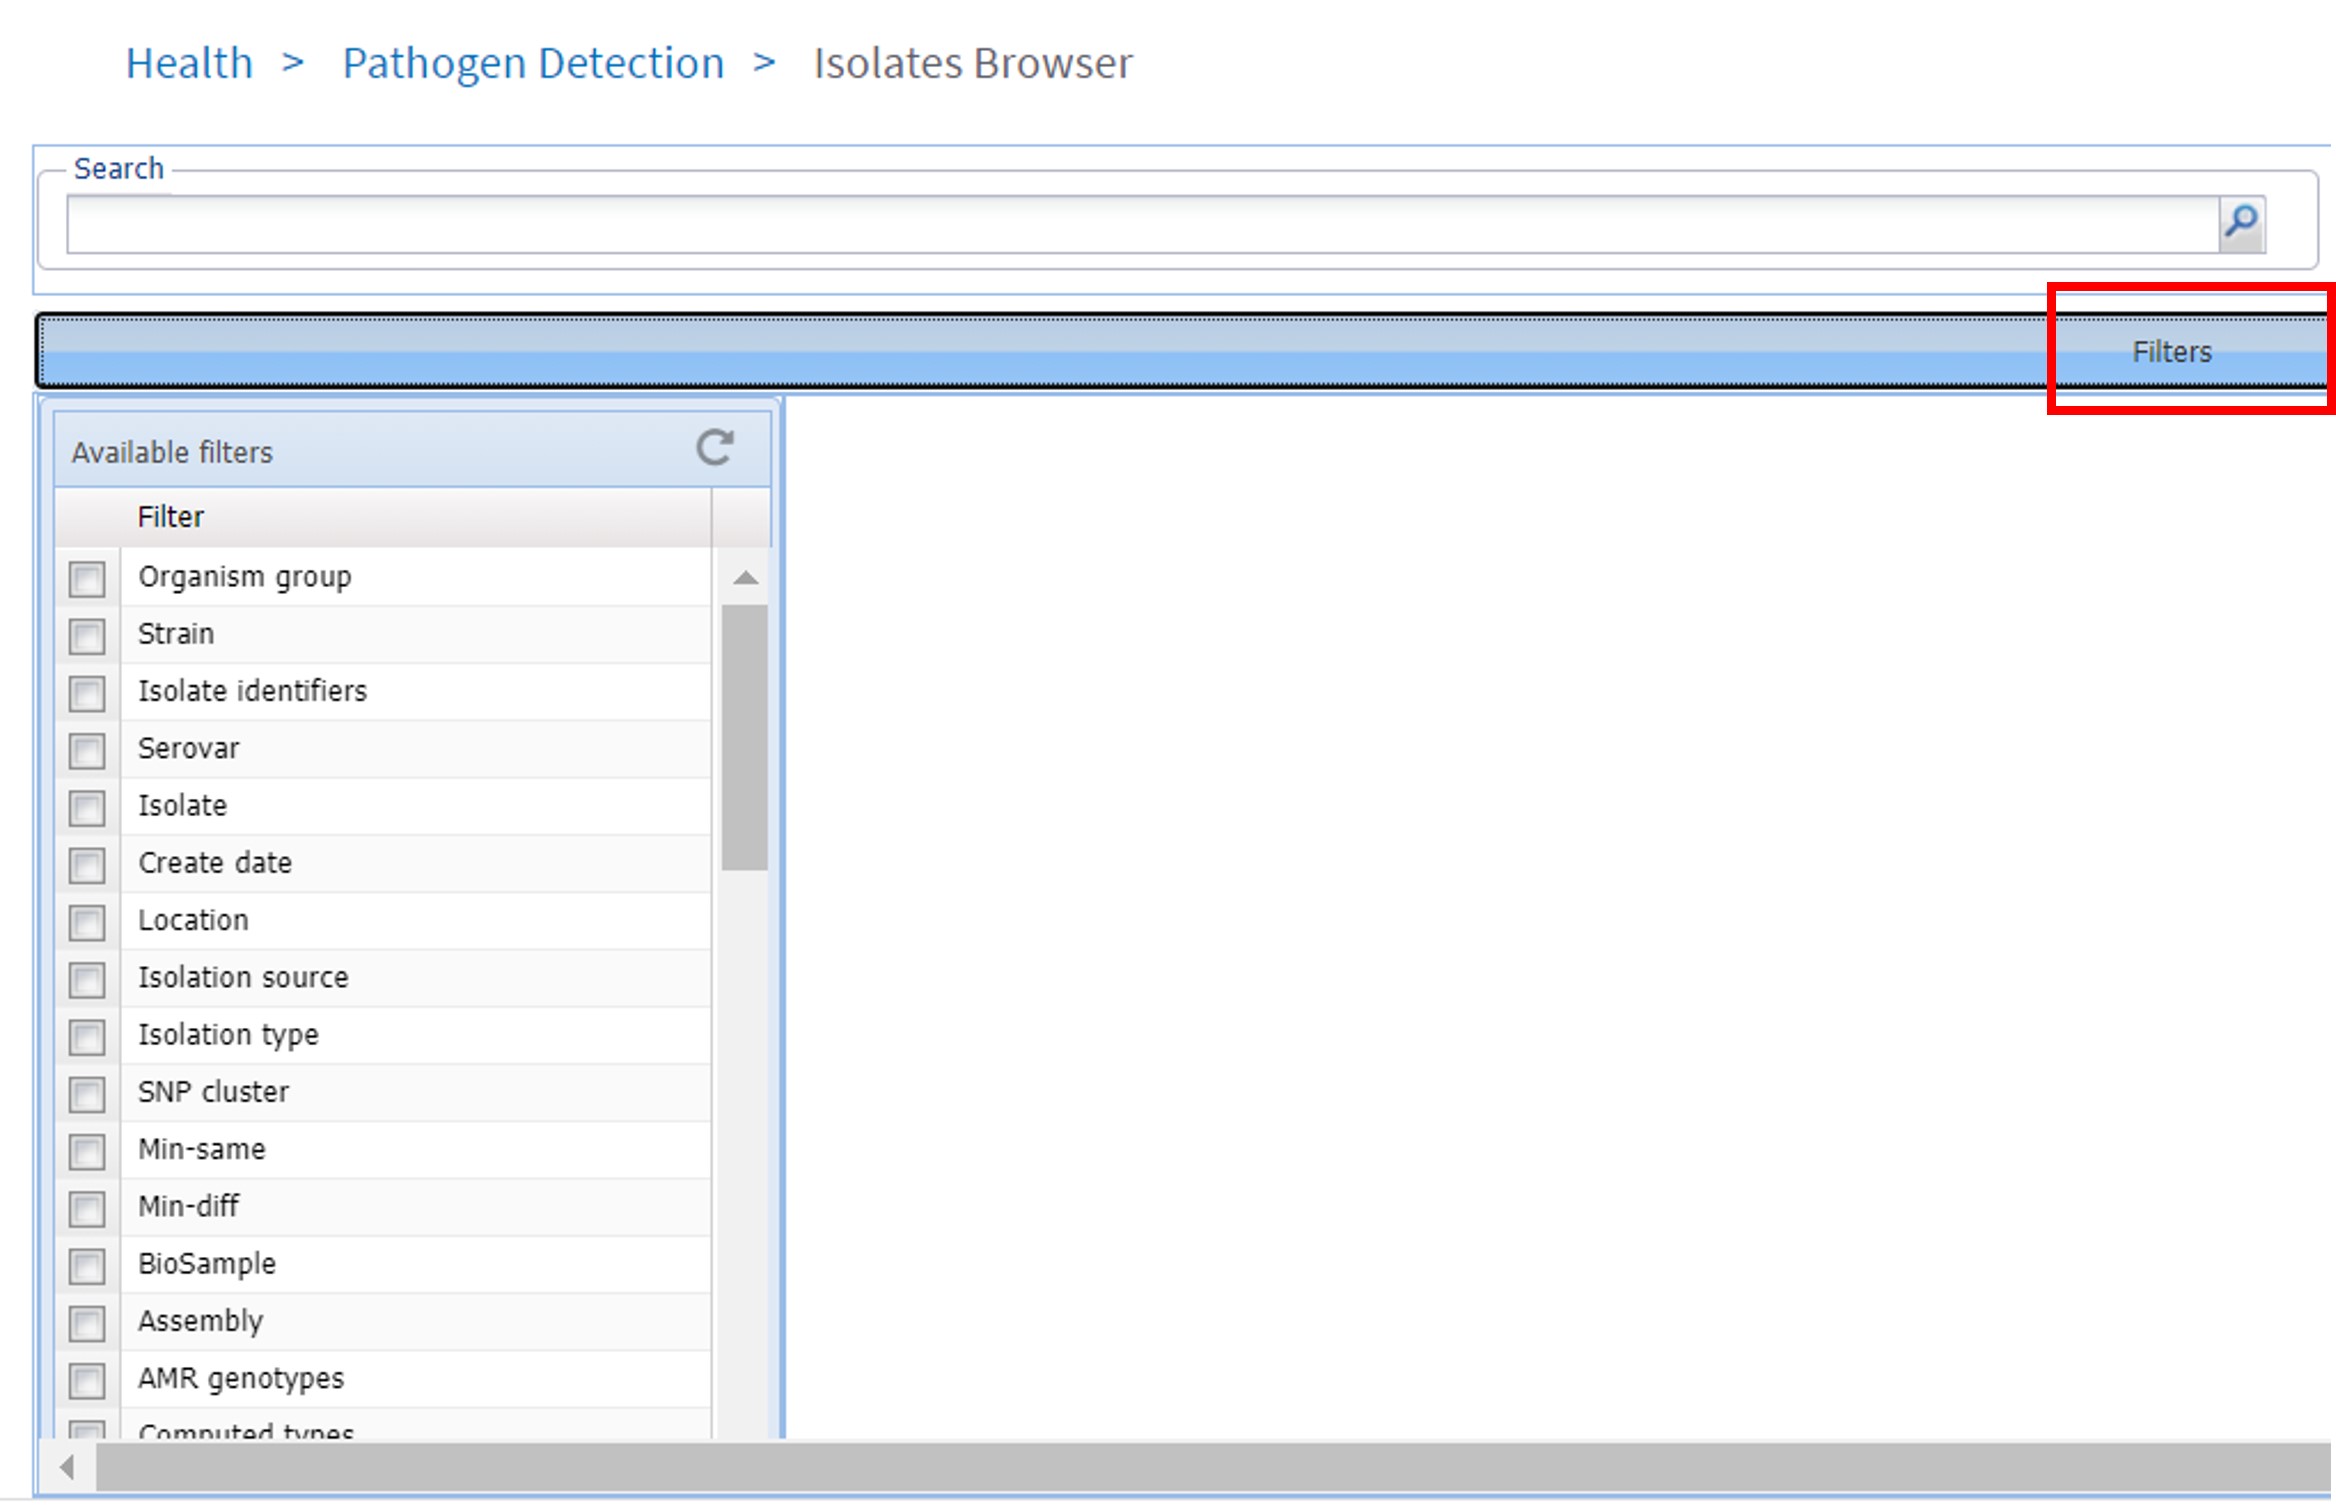
Figure 79: NCBI pathogen database: Isolate browser
The advantages of the NCBI pathogen Isolates browser is that we can search for pathogens in a geographic location such as the Netherlands
- Fill out as shown in Figure 80
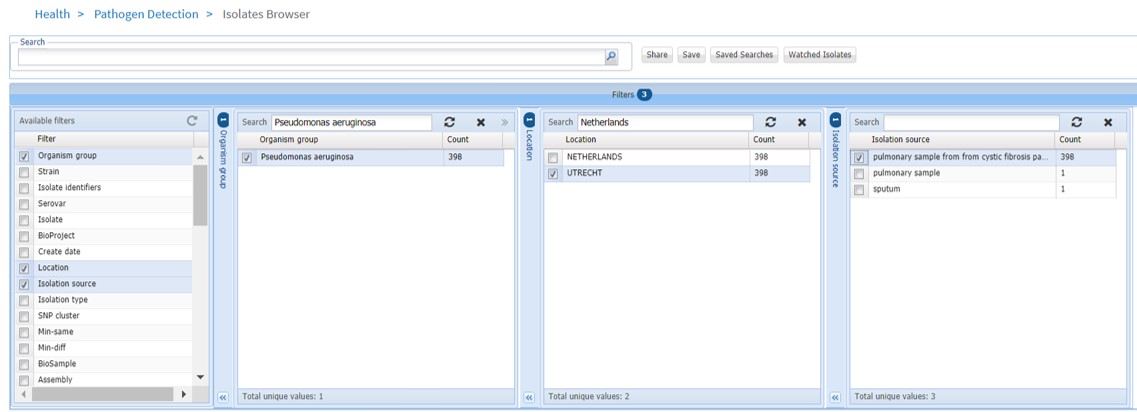
Figure 80: Isolate browser: filters
- Scroll down to “Matched Isolates” (Figure 81)
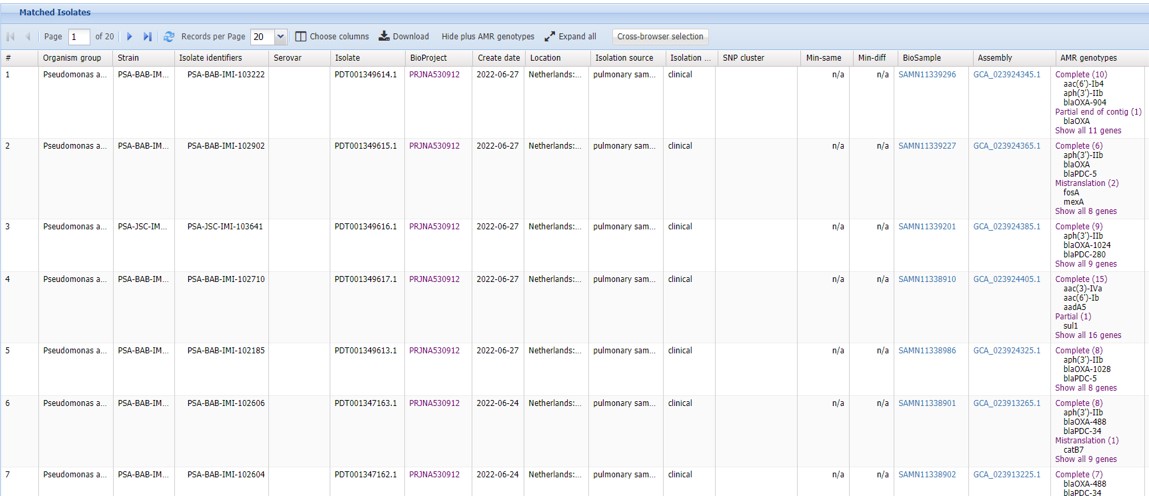
Figure 81: Isolate browser: filters
We have obtained a list of Pseudomonas aeruginosa strains from patients with cystic fibrosis that have been sequenced. The column AMR genotypes (on the right hand side) shows a list of AMR genes present in these strains. This list has been downloaded and is present in the shared folder as file lesson_08_opdracht10_isolates.tsv.
- Copy this file to your home directory -> lesson_08
lesson_08_assignment
The researcher wants to count how often each listed unique AMR gene is present in these 398 isolates of Pseudomonas aeruginosa. The researcher decides to use bash and to write a script.
We want you to think about the steps (not the actually bash code) on how to achieve this task. This is called pseudocoding. As a non-computer example, think about which steps you need to execute, to boil an egg.
- Write down all the steps that you will have to execute to answer this question. The main issue is how to clean up and organize the data so that you are able to count how many AMR genes are present in the dataset
- In the shared folder is script lesson_08_opdracht10_AMR.sh
- Copy this script to your home directory -> lesson_08
- Use this script to answer (B)
- Which AMR gene is mostly present in the genome of the Pseudomonas aeruginosa strains